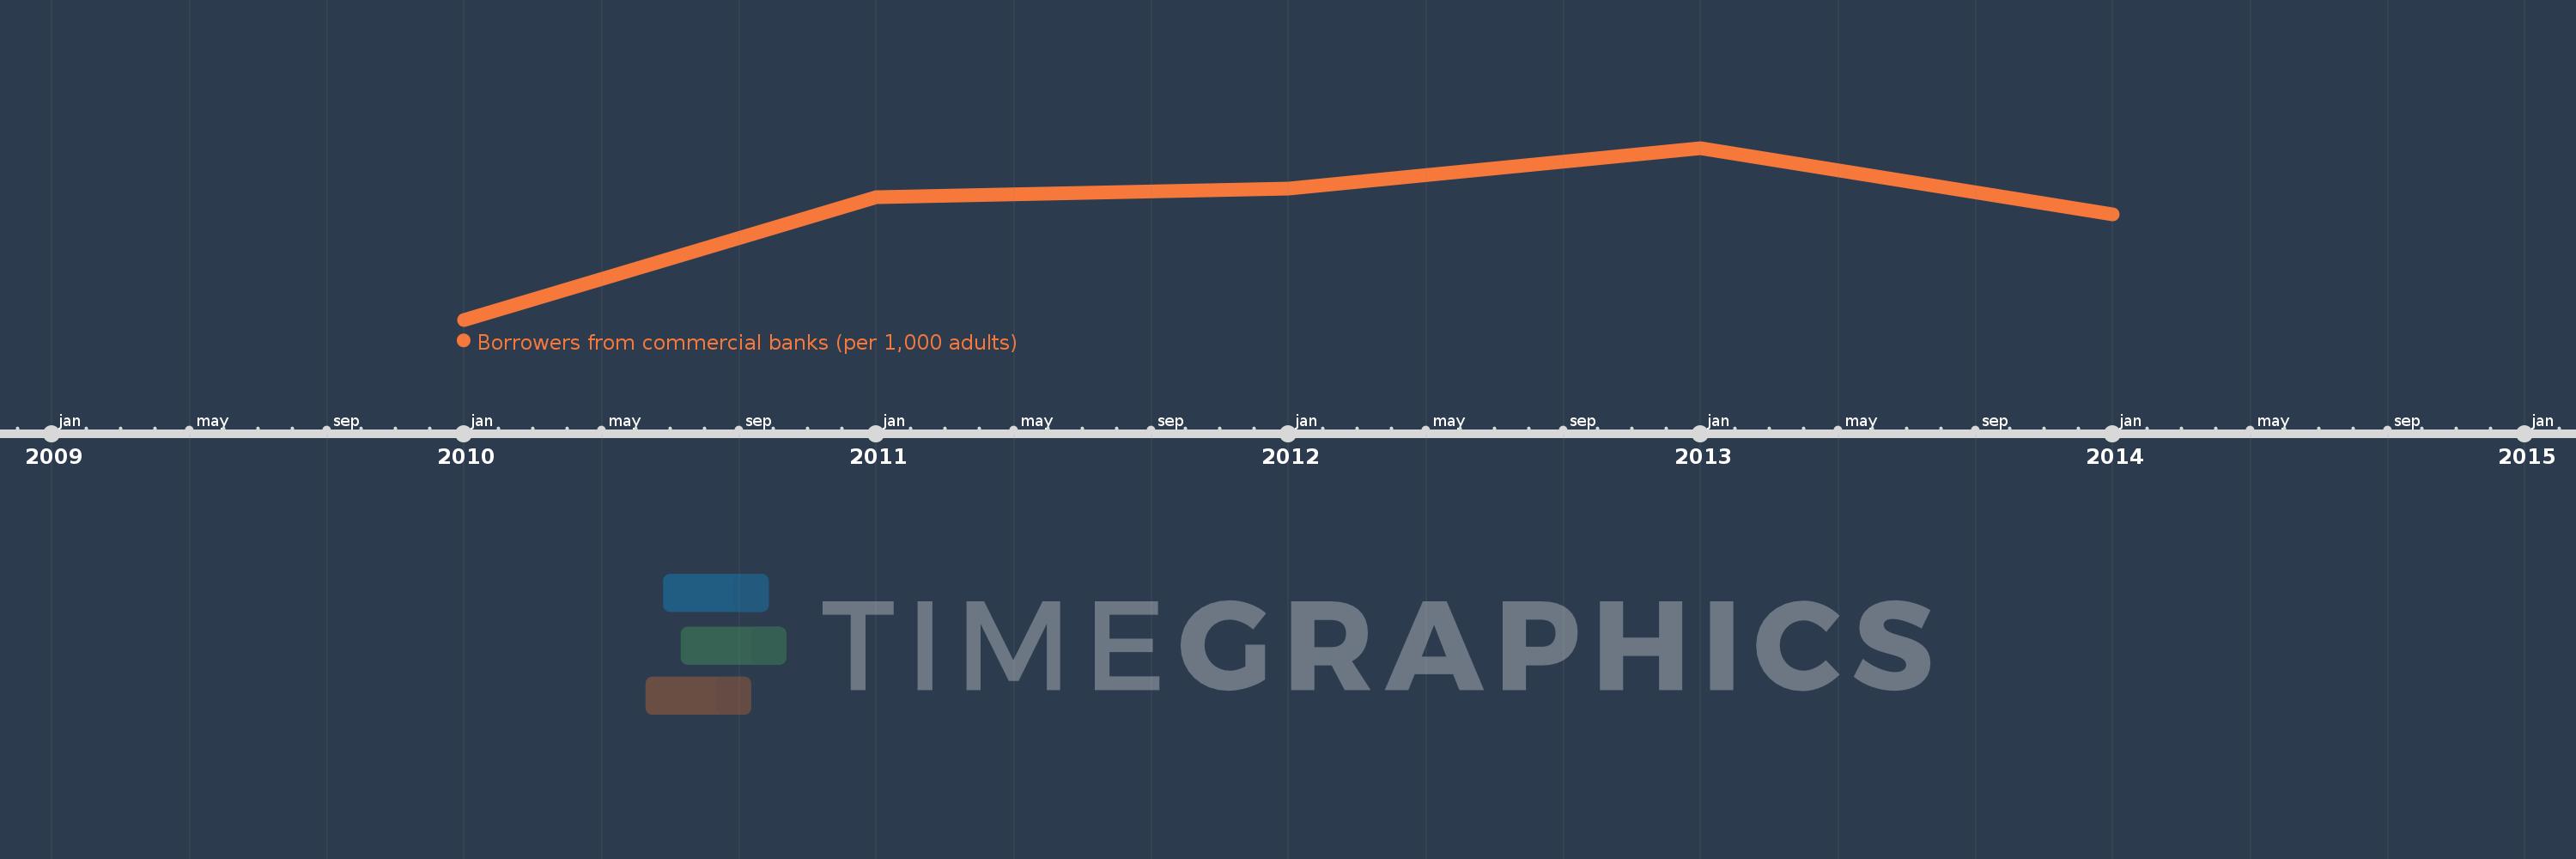
This timeline shows a graph from 2010 to 2014 of Fragile and conflict affected situations. No data until 2009. Number of actual observations by date: 5.
Source name:
World Development Indicators
Source organization:
International Monetary Fund, Financial Access Survey.
Categories, topics:
Financial Sector
Last updated:
apr 23, 2017
Indicators value changes by year
Meaning:
10.859
Minimum:
7.848
jan 1, 2010
Maximum:
12.721
jan 1, 2013
At the date of observation
Value
Absolute change
Change from the previous value
jan 1, 2010
7.848
+7.848
0.0%
jan 1, 2011
11.318
+3.47
44.21%
jan 1, 2012
11.571
+0.253
2.24%
jan 1, 2013
12.721
+1.15
9.94%
jan 1, 2014
10.837
-1.883
-14.81%
Ranking of countries by current statistics by years