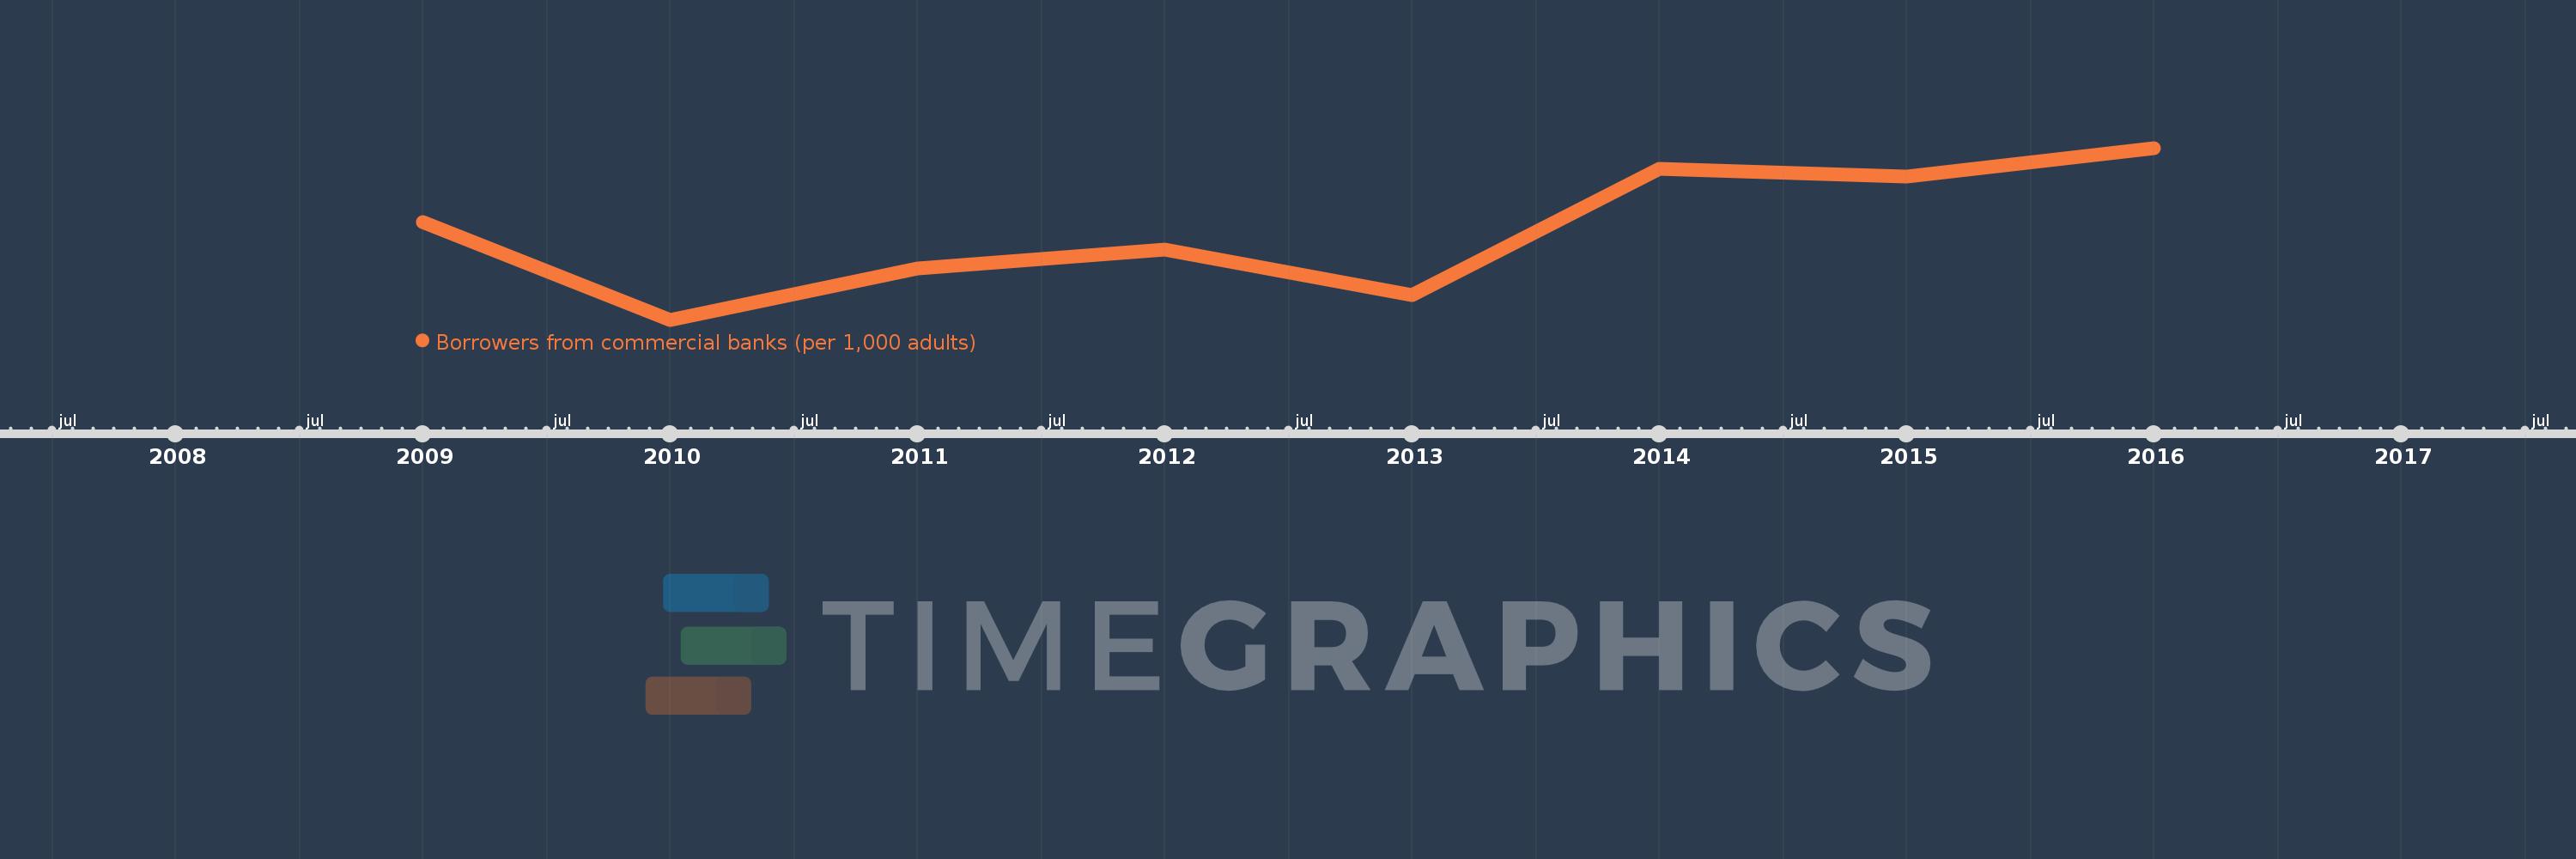
This timeline shows a graph from 2009 to 2016 of Middle East & North Africa (excluding high income). No data until 2008. Number of actual observations by date: 8.
Source name:
World Development Indicators
Source organization:
International Monetary Fund, Financial Access Survey.
Categories, topics:
Financial Sector
Last updated:
apr 23, 2017
Indicators value changes by year
Meaning:
92.399
Minimum:
72.456
jan 1, 2010
Maximum:
111.093
jan 1, 2016
At the date of observation
Value
Absolute change
Change from the previous value
jan 1, 2009
94.447
+94.447
0.0%
jan 1, 2010
72.456
-21.991
-23.28%
jan 1, 2011
83.896
+11.44
15.79%
jan 1, 2012
88.196
+4.3
5.12%
jan 1, 2013
78.038
-10.158
-11.52%
jan 1, 2014
106.489
+28.451
36.46%
jan 1, 2015
104.573
-1.916
-1.8%
jan 1, 2016
111.093
+6.52
6.23%
Ranking of countries by current statistics by years