Download This statistics in other country:
Timeline:
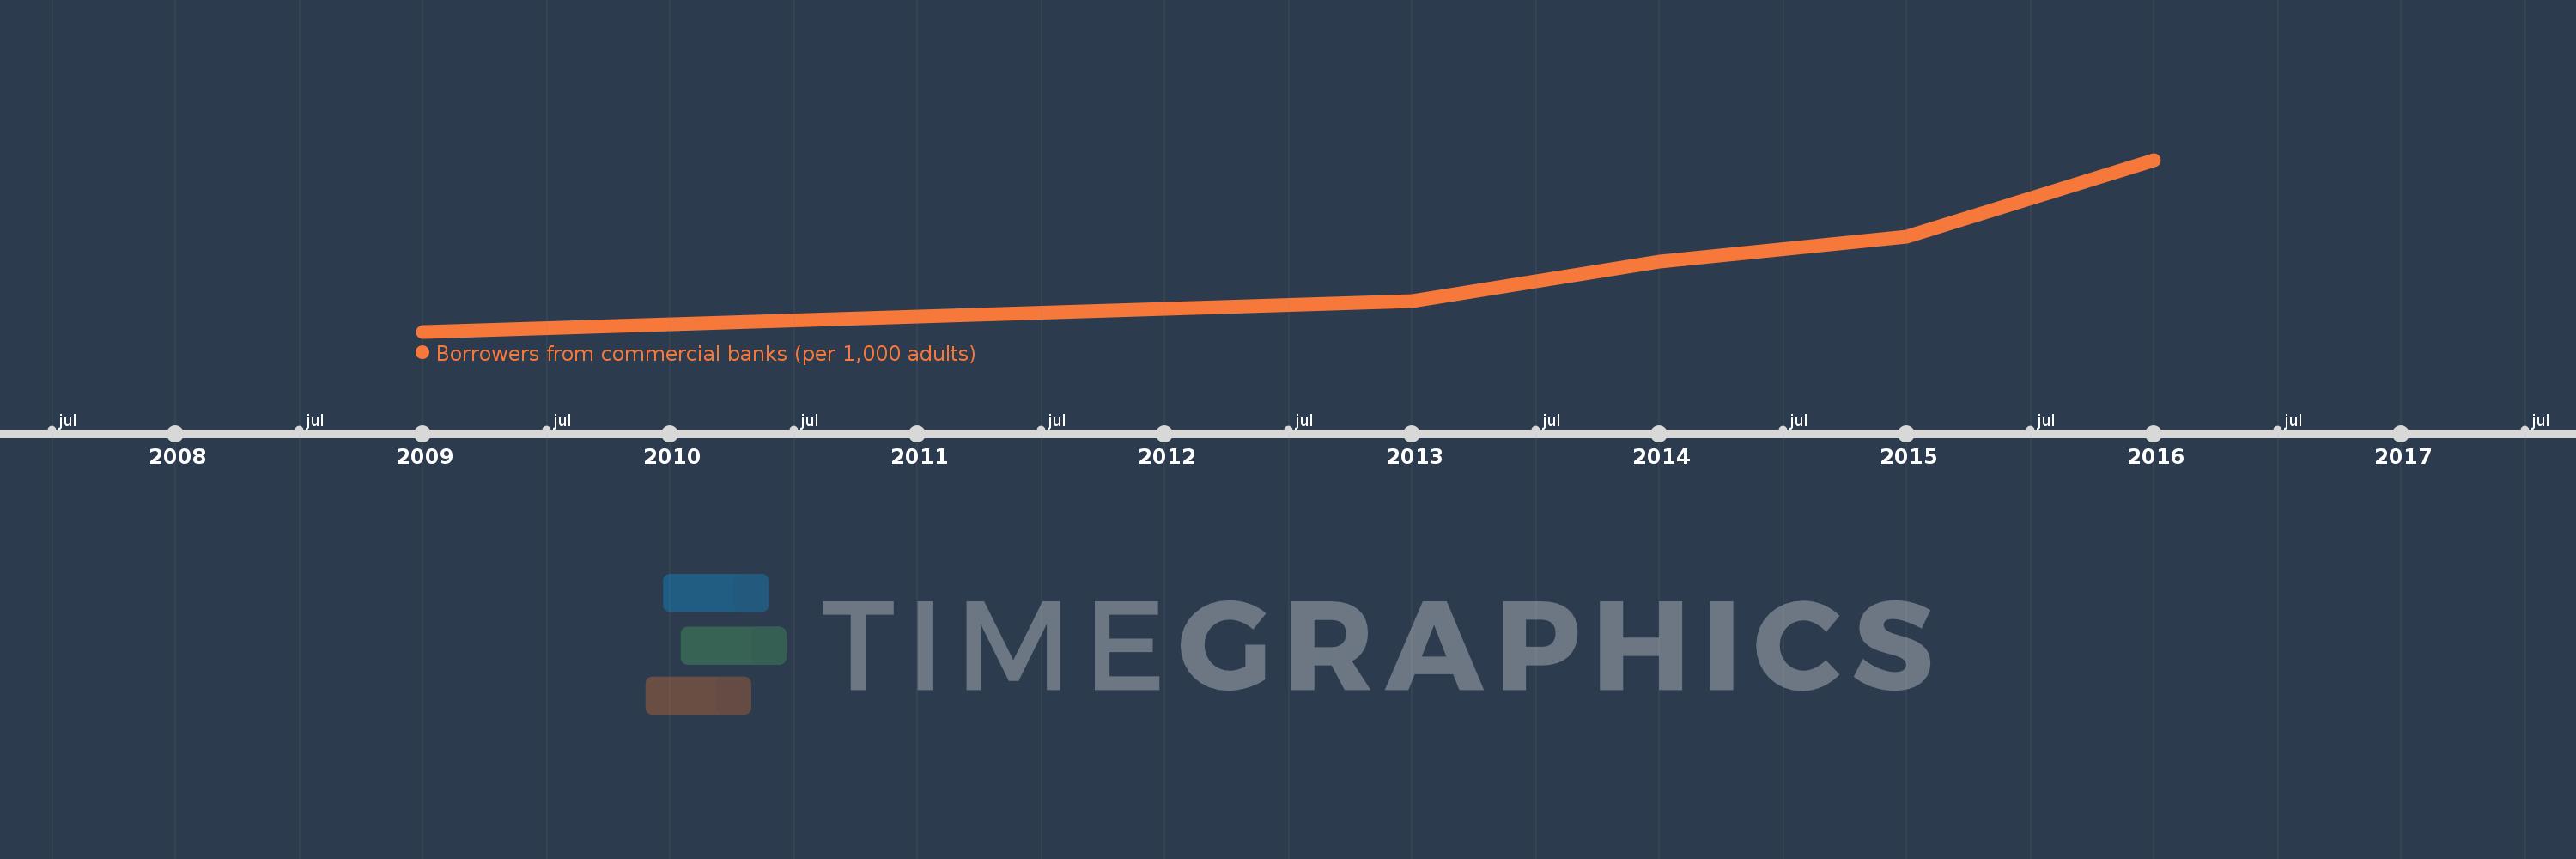
This timeline shows a graph from 2009 to 2016 of Mauritania. No data until 2008. Number of actual observations by date: 5.
Source name:
World Development Indicators
Source organization:
International Monetary Fund, Financial Access Survey.
Categories, topics:
Financial Sector
Last updated:
apr 23, 2017
Indicators value changes by year
Minimum:
31.148
jan 1, 2009
Maximum:
62.864
jan 1, 2016
At the date of observation
Value
Absolute change
Change from the previous value
jan 1, 2009
31.148
+31.148
0.0%
jan 1, 2013
36.781
+5.633
18.08%
jan 1, 2014
44.101
+7.32
19.9%
jan 1, 2015
48.702
+4.6
10.43%
jan 1, 2016
62.864
+14.162
29.08%
Ranking of countries by current statistics by years