33
/
AIzaSyB4mHJ5NPEv-XzF7P6NDYXjlkCWaeKw5bc
November 30, 2025
227192
Qatar
QAT
true
2
1
Borrowers from commercial banks (per 1,000 adults)
2016,2015,2014,2013,2012,2011,2010,2009,2008,2007,2006,2005
Create a timeline
Public Timelines
For education
For educational institutions
For teachers
For students
Cabinet
For educational institutions
For teachers
For students
Open cabinet
FAQ
Close
Create a timeline
Public timelines
FAQ
About & Feedback
Terms
Privacy
FAQ
Support 24/7
Cabinet
Get premium
Donate
Download
Global statistics library
→
Qatar
→
Borrowers from commercial banks (per 1,000 adults)
This statistics in other country:
Afghanistan
Albania
Algeria
Angola
Arab World
Argentina
Azerbaijan
Bangladesh
Belgium
Belize
Bolivia
Bosnia and Herzegovina
Botswana
Brazil
Brunei Darussalam
Burundi
Cabo Verde
Cameroon
Central African Republic
Central Europe and the Baltics
Chad
Chile
China
Colombia
Comoros
Congo, Dem. Rep.
Congo, Rep.
Costa Rica
Croatia
Djibouti
Dominican Republic
Early-demographic dividend
East Asia & Pacific (excluding high income)
East Asia & Pacific (IDA & IBRD countries)
Ecuador
Egypt, Arab Rep.
El Salvador
Equatorial Guinea
Estonia
Ethiopia
Europe & Central Asia (excluding high income)
Europe & Central Asia (IDA & IBRD countries)
Fragile and conflict affected situations
Gabon
Georgia
Ghana
Guatemala
Guinea
Haiti
Heavily indebted poor countries (HIPC)
Honduras
Hungary
IBRD only
IDA & IBRD total
IDA blend
IDA only
IDA total
Indonesia
Israel
Italy
Kenya
Kiribati
Kosovo
Kuwait
Kyrgyz Republic
Lao PDR
Late-demographic dividend
Latin America & Caribbean
Latin America & Caribbean (excluding high income)
Latin America & the Caribbean (IDA & IBRD countries)
Latvia
Least developed countries: UN classification
Lebanon
Lesotho
Liberia
Libya
Low & middle income
Low income
Lower middle income
Macedonia, FYR
Madagascar
Malawi
Malaysia
Maldives
Mauritania
Middle East & North Africa
Middle East & North Africa (excluding high income)
Middle East & North Africa (IDA & IBRD countries)
Middle income
Moldova
Montenegro
Mozambique
Myanmar
Namibia
Nigeria
Other small states
Pakistan
Palau
Paraguay
Peru
Poland
Portugal
Pre-demographic dividend
Qatar
Romania
Rwanda
Samoa
San Marino
Sao Tome and Principe
Saudi Arabia
Serbia
Seychelles
Sierra Leone
Singapore
Small states
Solomon Islands
South Asia
South Asia (IDA & IBRD)
South Sudan
Sub-Saharan Africa
Sub-Saharan Africa (excluding high income)
Sub-Saharan Africa (IDA & IBRD countries)
Suriname
Swaziland
Syrian Arab Republic
Tajikistan
Tanzania
Thailand
Timor-Leste
Tunisia
Turkey
Uganda
United Kingdom
Upper middle income
Uruguay
Uzbekistan
Vanuatu
West Bank and Gaza
World
Yemen, Rep.
Zambia
Zimbabwe
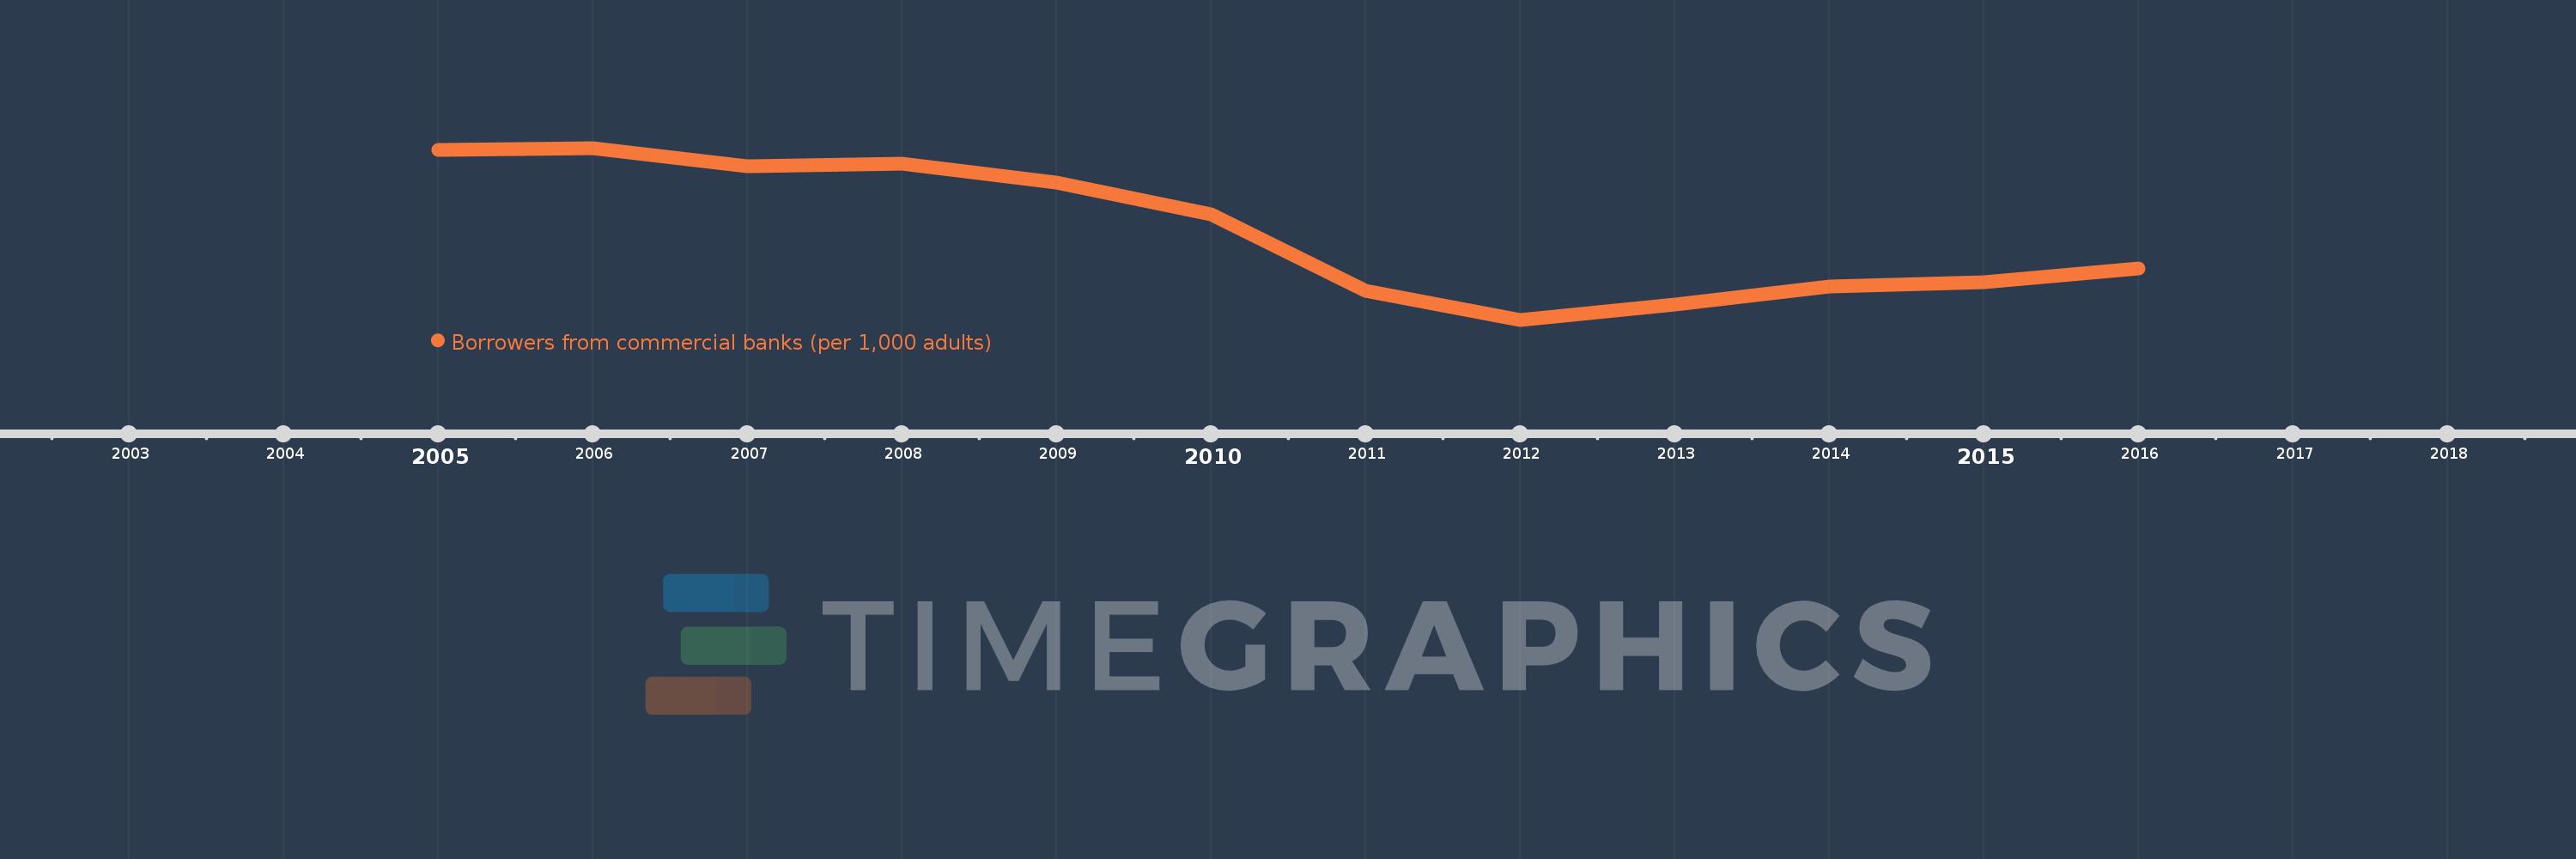
Timeline:
This timeline shows a graph from
2005
to
2016
of Qatar. No data until
2004
. Number of actual observations by date:
12
.
Source name:
World Development Indicators
Source organization:
International Monetary Fund, Financial Access Survey.
Categories, topics:
Financial Sector
Last updated:
apr 23, 2017
Indicators value changes by year
Meaning:
291.29
Minimum:
221.943
jan 1, 2012
Maximum:
356.817
jan 1, 2006
At the date of observation
Value
Absolute change
Change from the previous value
jan 1, 2005
355.272
+355.272
0.0%
jan 1, 2006
356.817
+1.545
0.43%
jan 1, 2007
342.779
-14.038
-3.93%
jan 1, 2008
344.627
+1.847
0.54%
jan 1, 2009
329.642
-14.985
-4.35%
jan 1, 2010
304.446
-25.196
-7.64%
jan 1, 2011
244.448
-59.998
-19.71%
jan 1, 2012
221.943
-22.505
-9.21%
jan 1, 2013
233.89
+11.947
5.38%
jan 1, 2014
247.74
+13.85
5.92%
jan 1, 2015
251.506
+3.766
1.52%
jan 1, 2016
262.372
+10.866
4.32%
Ranking of countries by current statistics by years
About & Feedback
Terms
Privacy
FAQ
Support 24/7
Cabinet
Get premium
Donate
The service accepts bank transfer (ACH, Wire) or cards (Visa, MasterCard, etc). Processed by Stripe.
Secured with SSL