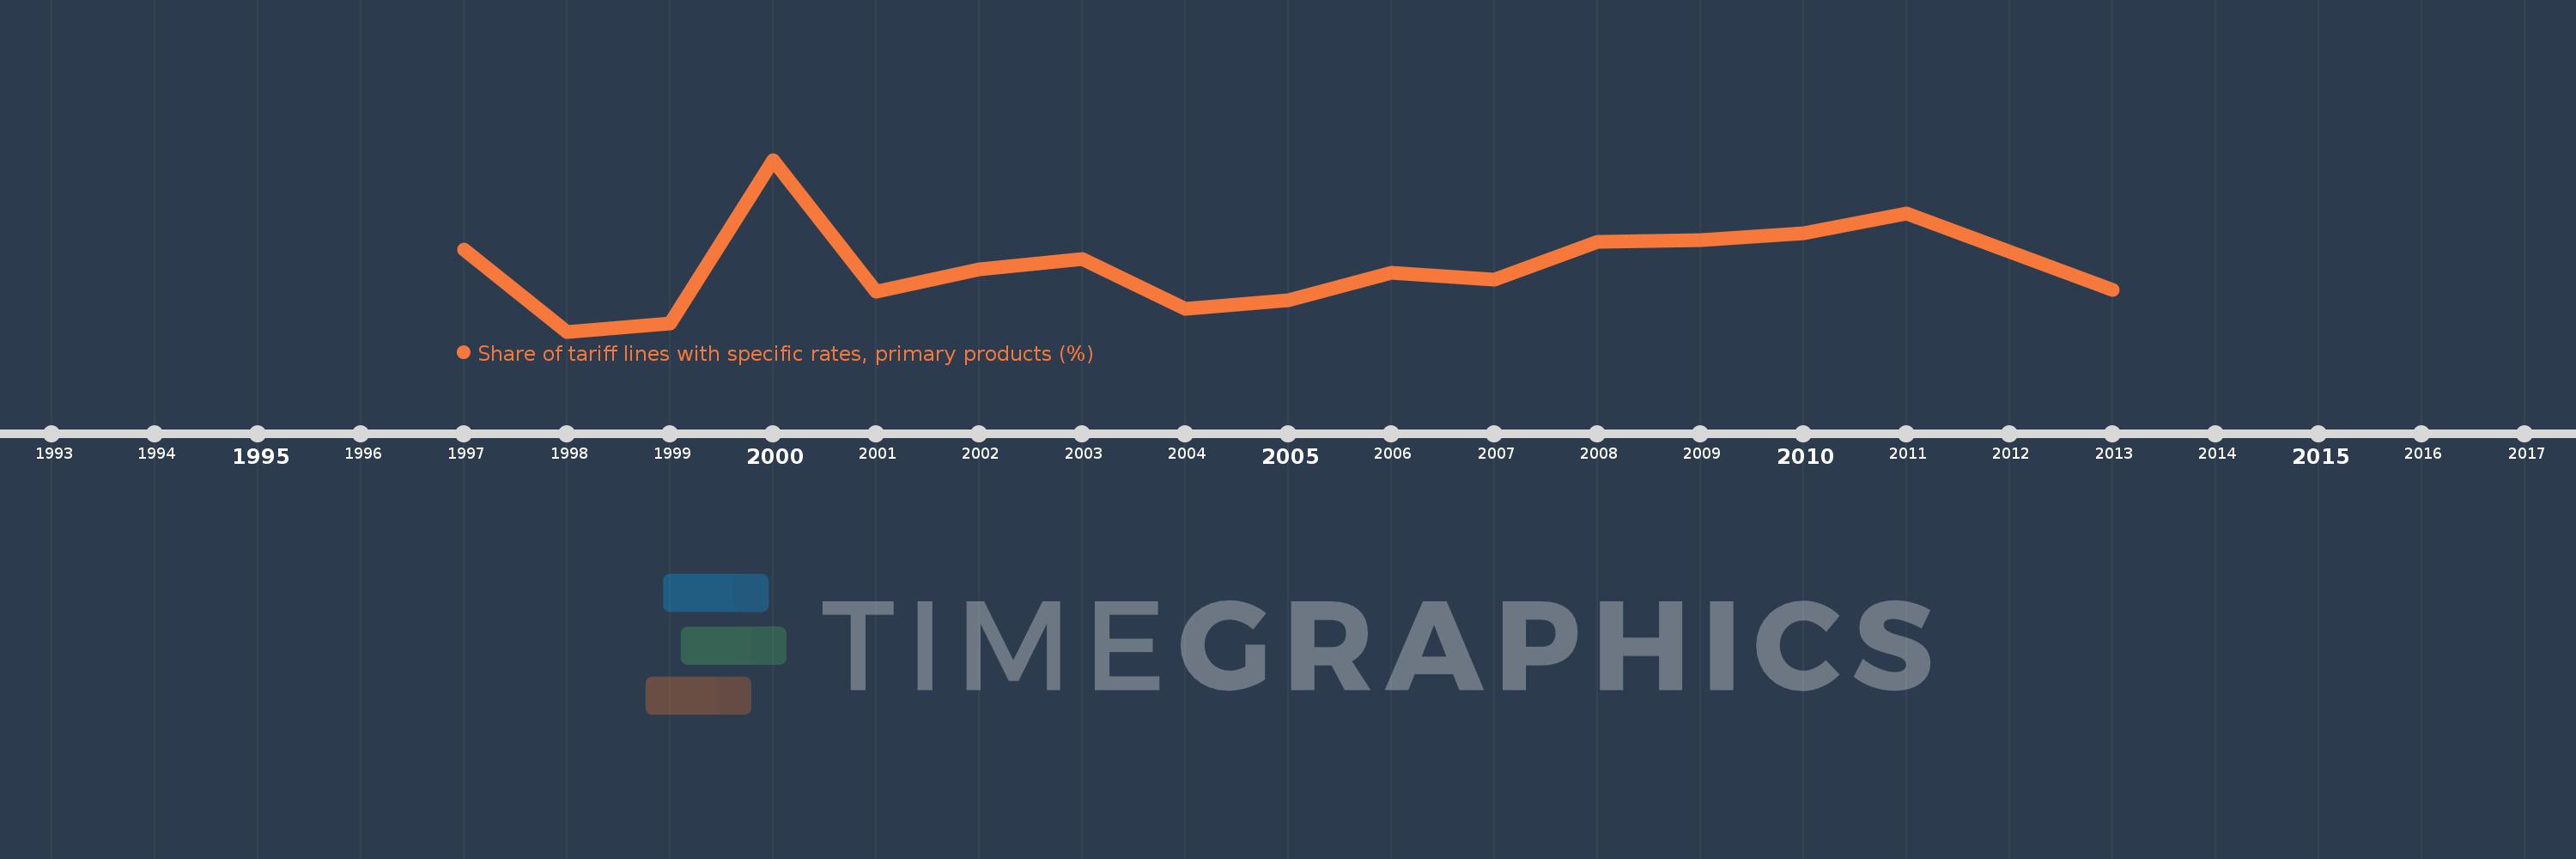
This timeline shows a graph from 1997 to 2013 of Upper middle income. No data until 1996. Number of actual observations by date: 16.
Source name:
World Development Indicators
Source organization:
World Bank staff estimates using the World Integrated Trade Solution system, based on data from United Nations Conference on Trade and Development's Trade Analysis and Information System (TRAINS) database.
Categories, topics:
Private Sector, Trade
Last updated:
apr 23, 2017
Indicators value changes by year
Meaning:
6.659
Minimum:
0.916
jan 1, 1998
Maximum:
16.091
jan 1, 2000
At the date of observation
Value
Absolute change
Change from the previous value
jan 1, 1997
8.142
+8.142
0.0%
jan 1, 1998
0.916
-7.226
-88.75%
jan 1, 1999
1.615
+0.699
76.39%
jan 1, 2000
16.091
+14.476
896.29%
jan 1, 2001
4.437
-11.655
-72.43%
jan 1, 2002
6.389
+1.953
44.02%
jan 1, 2003
7.303
+0.913
14.3%
jan 1, 2004
2.921
-4.382
-60.01%
jan 1, 2005
3.697
+0.776
26.58%
jan 1, 2006
6.133
+2.436
65.9%
jan 1, 2007
5.508
-0.626
-10.2%
jan 1, 2008
8.825
+3.317
60.23%
jan 1, 2009
9.025
+0.2
2.27%
jan 1, 2010
9.616
+0.59
6.54%
jan 1, 2011
11.335
+1.719
17.88%
jan 1, 2013
4.594
-6.741
-59.47%
Ranking of countries by current statistics by years