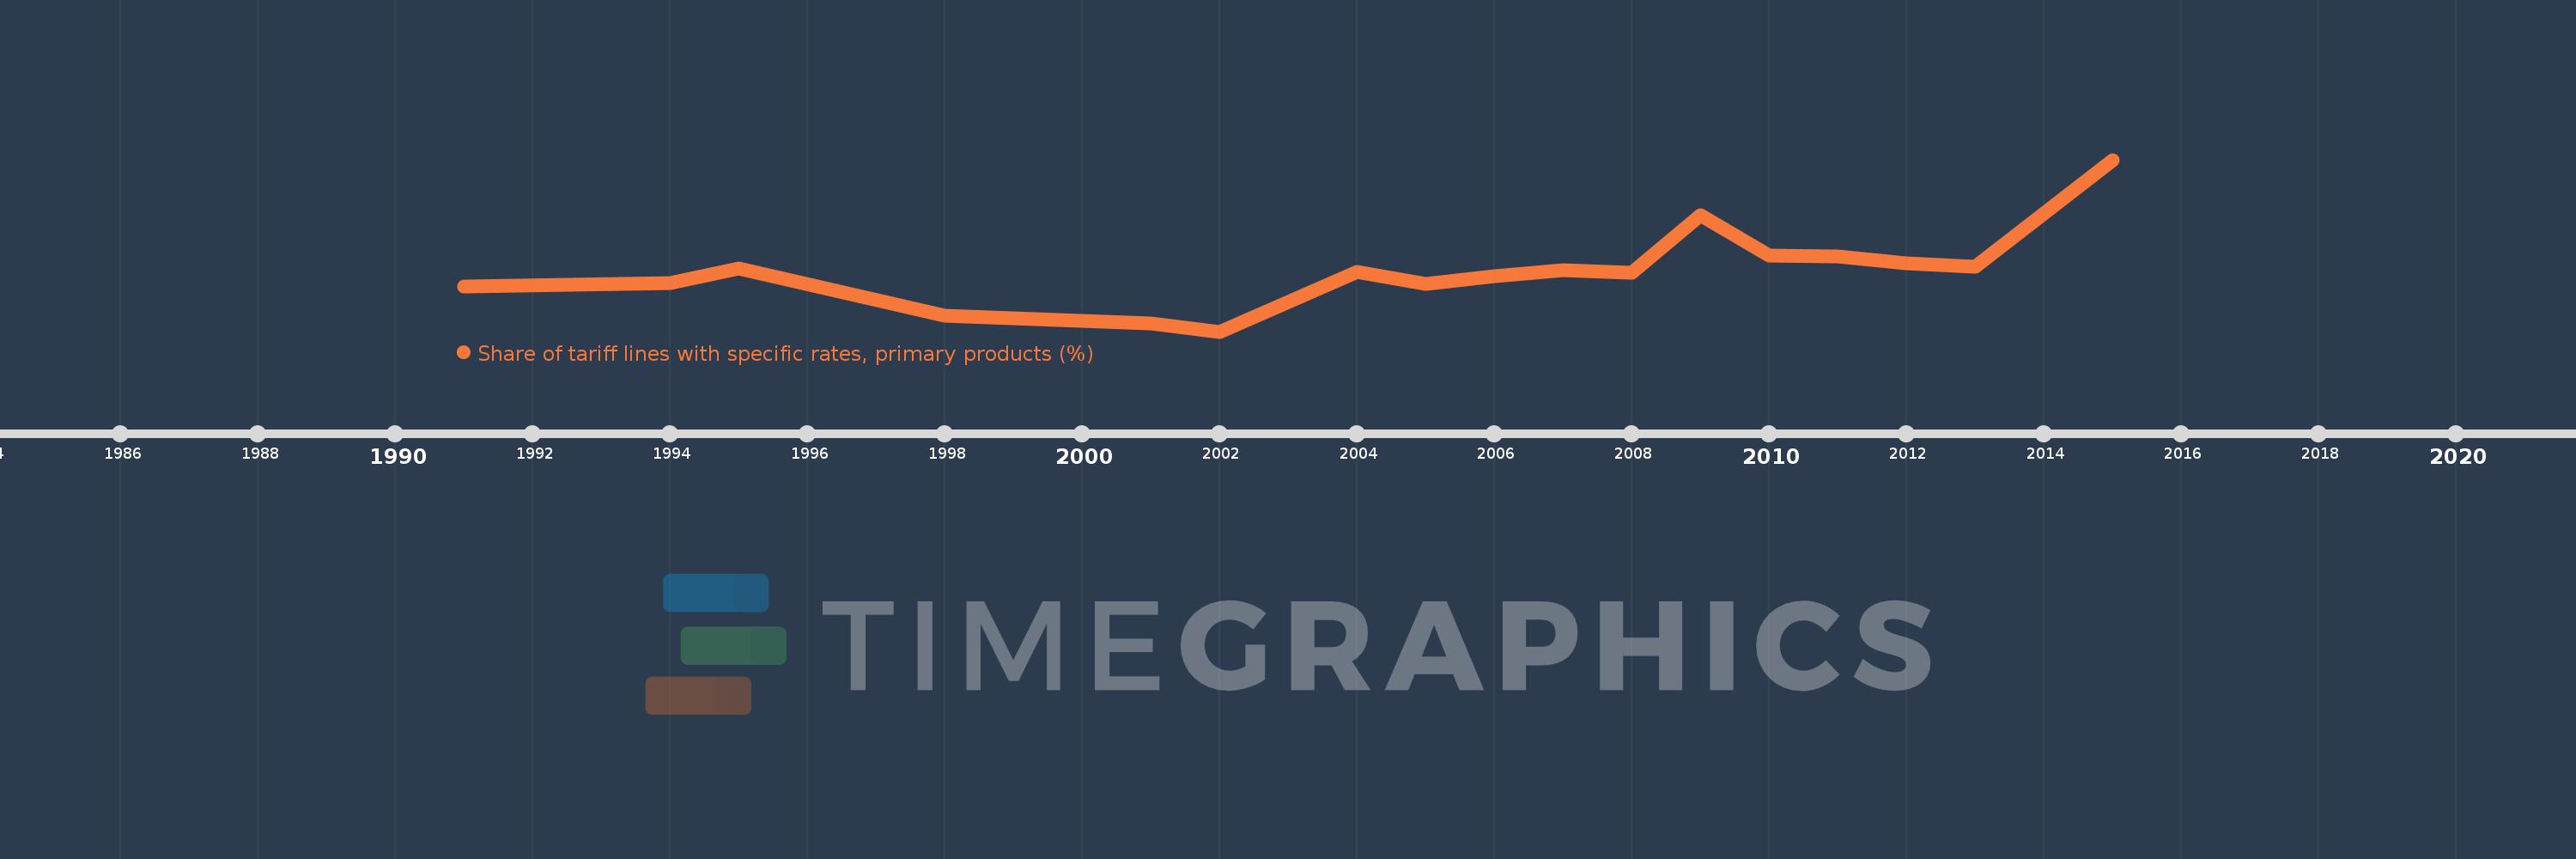
This timeline shows a graph from 1991 to 2015 of Sri Lanka. No data until 1990. Number of actual observations by date: 17.
Source name:
World Development Indicators
Source organization:
World Bank staff estimates using the World Integrated Trade Solution system, based on data from United Nations Conference on Trade and Development's Trade Analysis and Information System (TRAINS) database.
Categories, topics:
Private Sector, Trade
Last updated:
apr 23, 2017
Indicators value changes by year
Meaning:
6.448
Minimum:
3.486
jan 1, 2002
Maximum:
11.84
jan 1, 2015
At the date of observation
Value
Absolute change
Change from the previous value
jan 1, 1991
5.696
+5.696
0.0%
jan 1, 1994
5.845
+0.15
2.63%
jan 1, 1995
6.57
+0.724
12.39%
jan 1, 1998
4.263
-2.306
-35.11%
jan 1, 2001
3.87
-0.393
-9.22%
jan 1, 2002
3.486
-0.384
-9.93%
jan 1, 2004
6.373
+2.887
82.83%
jan 1, 2005
5.794
-0.579
-9.09%
jan 1, 2006
6.196
+0.403
6.95%
jan 1, 2007
6.471
+0.275
4.44%
jan 1, 2008
6.359
-0.112
-1.74%
jan 1, 2009
9.14
+2.781
43.74%
jan 1, 2010
7.167
-1.973
-21.59%
jan 1, 2011
7.125
-0.042
-0.59%
jan 1, 2012
6.797
-0.328
-4.6%
jan 1, 2013
6.621
-0.176
-2.59%
jan 1, 2015
11.84
+5.219
78.83%
Ranking of countries by current statistics by years