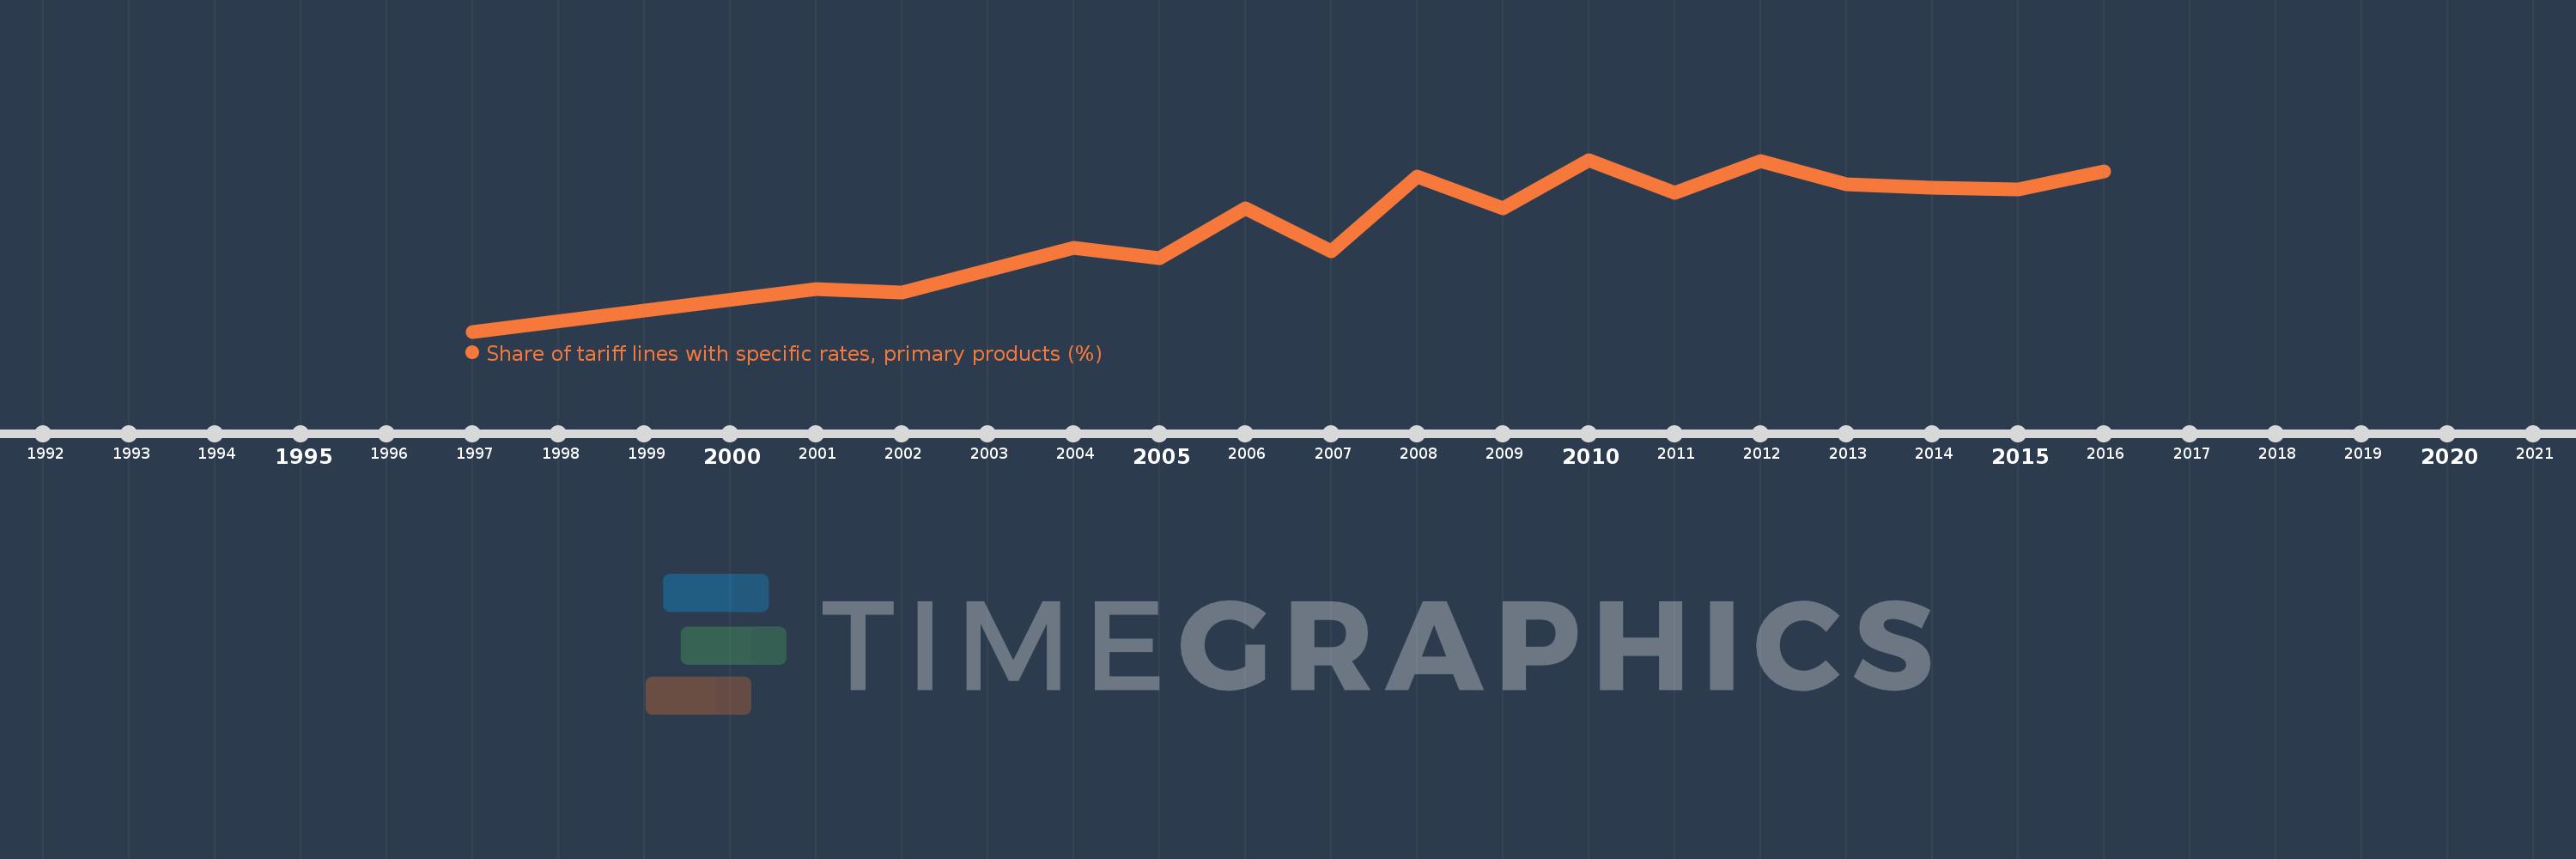
This timeline shows a graph from 1997 to 2016 of Moldova. No data until 1996. Number of actual observations by date: 16.
Source name:
World Development Indicators
Source organization:
World Bank staff estimates using the World Integrated Trade Solution system, based on data from United Nations Conference on Trade and Development's Trade Analysis and Information System (TRAINS) database.
Categories, topics:
Private Sector, Trade
Last updated:
apr 23, 2017
Indicators value changes by year
Meaning:
8.952
Minimum:
0.0
jan 1, 1997
Maximum:
13.701
jan 1, 2010
At the date of observation
Value
Absolute change
Change from the previous value
jan 1, 1997
0.0
0.0
0.0%
jan 1, 2001
3.404
+3.404
%
jan 1, 2002
3.145
-0.259
-7.62%
jan 1, 2004
6.707
+3.562
113.28%
jan 1, 2005
5.823
-0.884
-13.18%
jan 1, 2006
9.828
+4.004
68.76%
jan 1, 2007
6.401
-3.427
-34.87%
jan 1, 2008
12.336
+5.935
92.72%
jan 1, 2009
9.819
-2.516
-20.4%
jan 1, 2010
13.701
+3.882
39.54%
jan 1, 2011
11.094
-2.607
-19.03%
jan 1, 2012
13.586
+2.492
22.46%
jan 1, 2013
11.762
-1.824
-13.43%
jan 1, 2014
11.472
-0.29
-2.46%
jan 1, 2015
11.355
-0.117
-1.02%
jan 1, 2016
12.804
+1.449
12.76%
Ranking of countries by current statistics by years