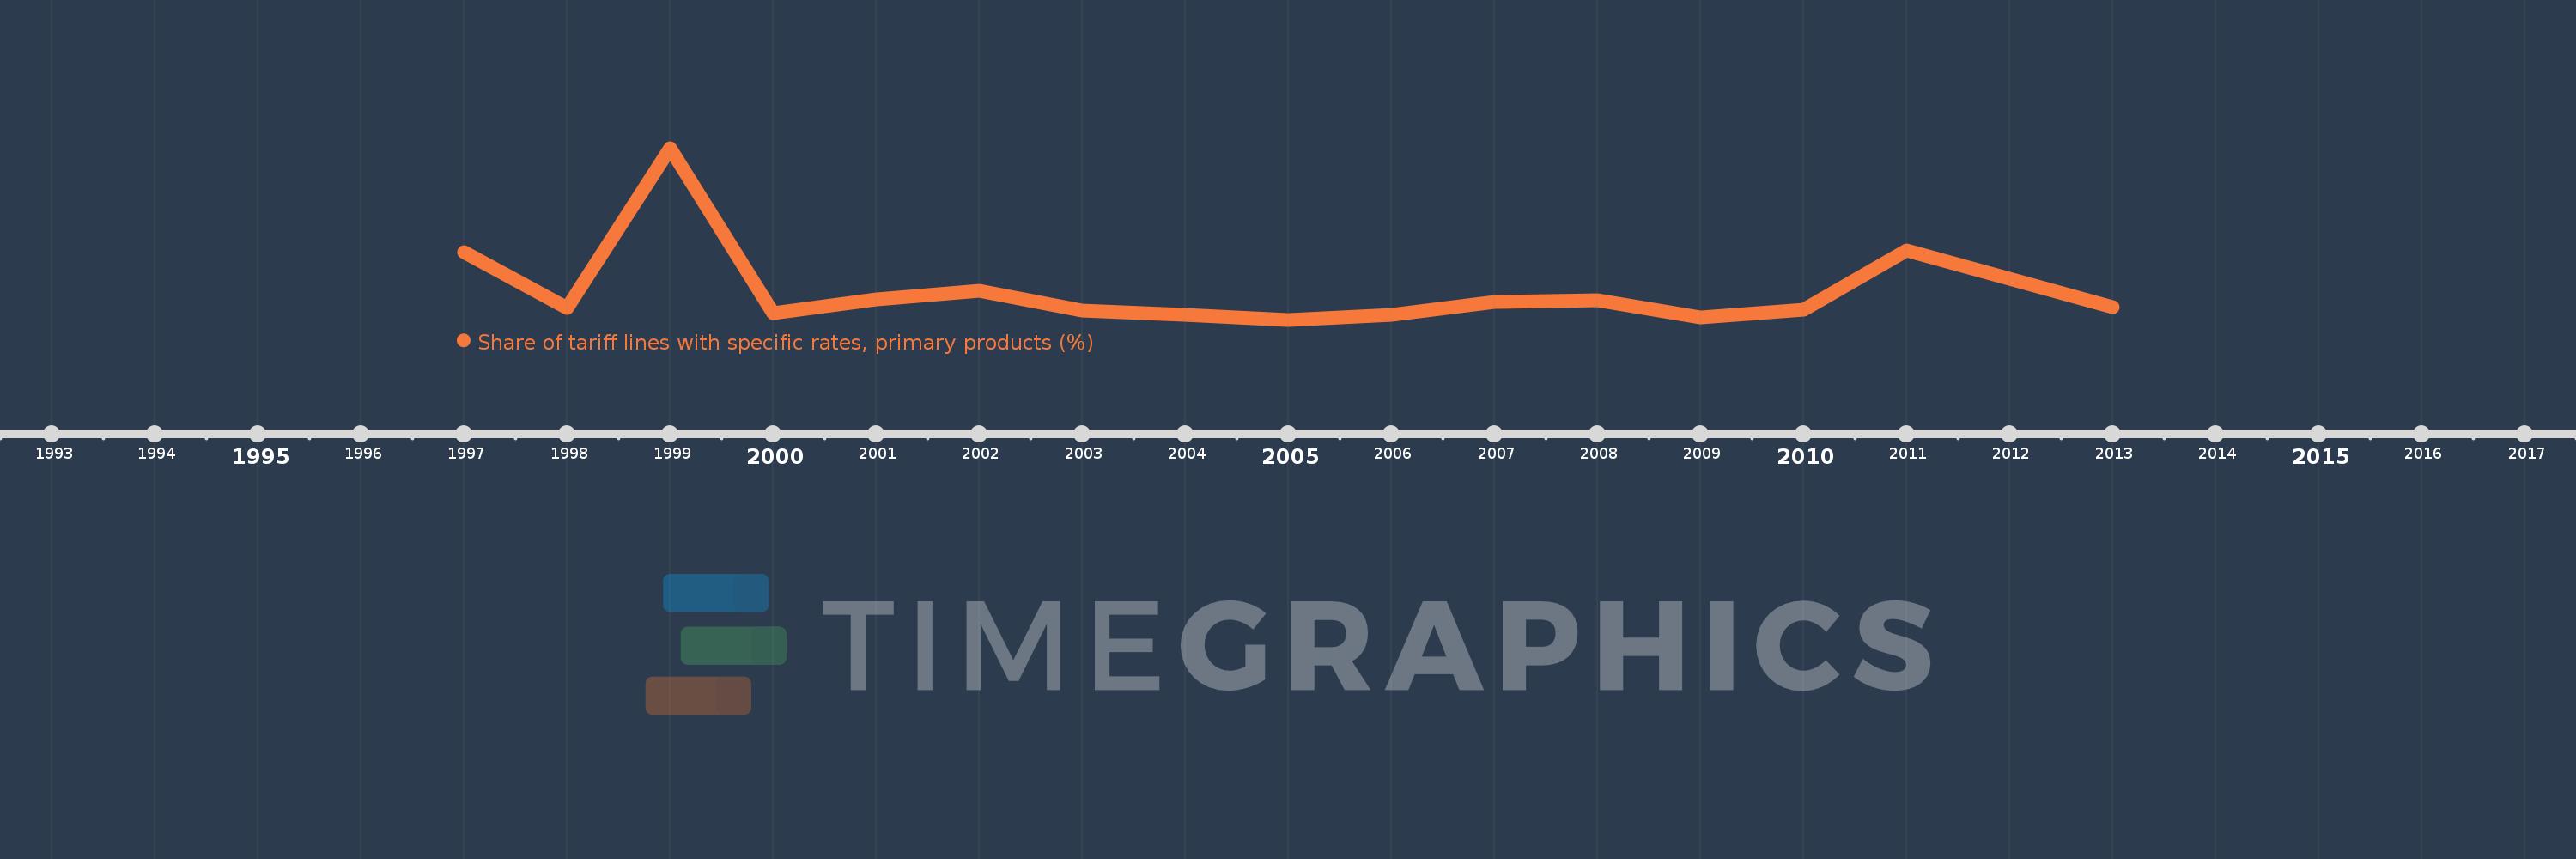
This timeline shows a graph from 1997 to 2013 of South Asia. No data until 1996. Number of actual observations by date: 16.
Source name:
World Development Indicators
Source organization:
World Bank staff estimates using the World Integrated Trade Solution system, based on data from United Nations Conference on Trade and Development's Trade Analysis and Information System (TRAINS) database.
Categories, topics:
Private Sector, Trade
Last updated:
apr 23, 2017
Indicators value changes by year
Meaning:
3.456
Minimum:
0.919
jan 1, 2005
Maximum:
16.103
jan 1, 1999
At the date of observation
Value
Absolute change
Change from the previous value
jan 1, 1997
6.873
+6.873
0.0%
jan 1, 1998
1.966
-4.906
-71.39%
jan 1, 1999
16.103
+14.137
718.9%
jan 1, 2000
1.504
-14.599
-90.66%
jan 1, 2001
2.732
+1.227
81.58%
jan 1, 2002
3.511
+0.78
28.54%
jan 1, 2003
1.742
-1.769
-50.38%
jan 1, 2004
1.34
-0.402
-23.1%
jan 1, 2005
0.919
-0.421
-31.4%
jan 1, 2006
1.376
+0.456
49.67%
jan 1, 2007
2.523
+1.148
83.43%
jan 1, 2008
2.66
+0.137
5.42%
jan 1, 2009
1.144
-1.516
-56.99%
jan 1, 2010
1.822
+0.678
59.28%
jan 1, 2011
7.068
+5.246
287.84%
jan 1, 2013
2.003
-5.065
-71.66%
Ranking of countries by current statistics by years