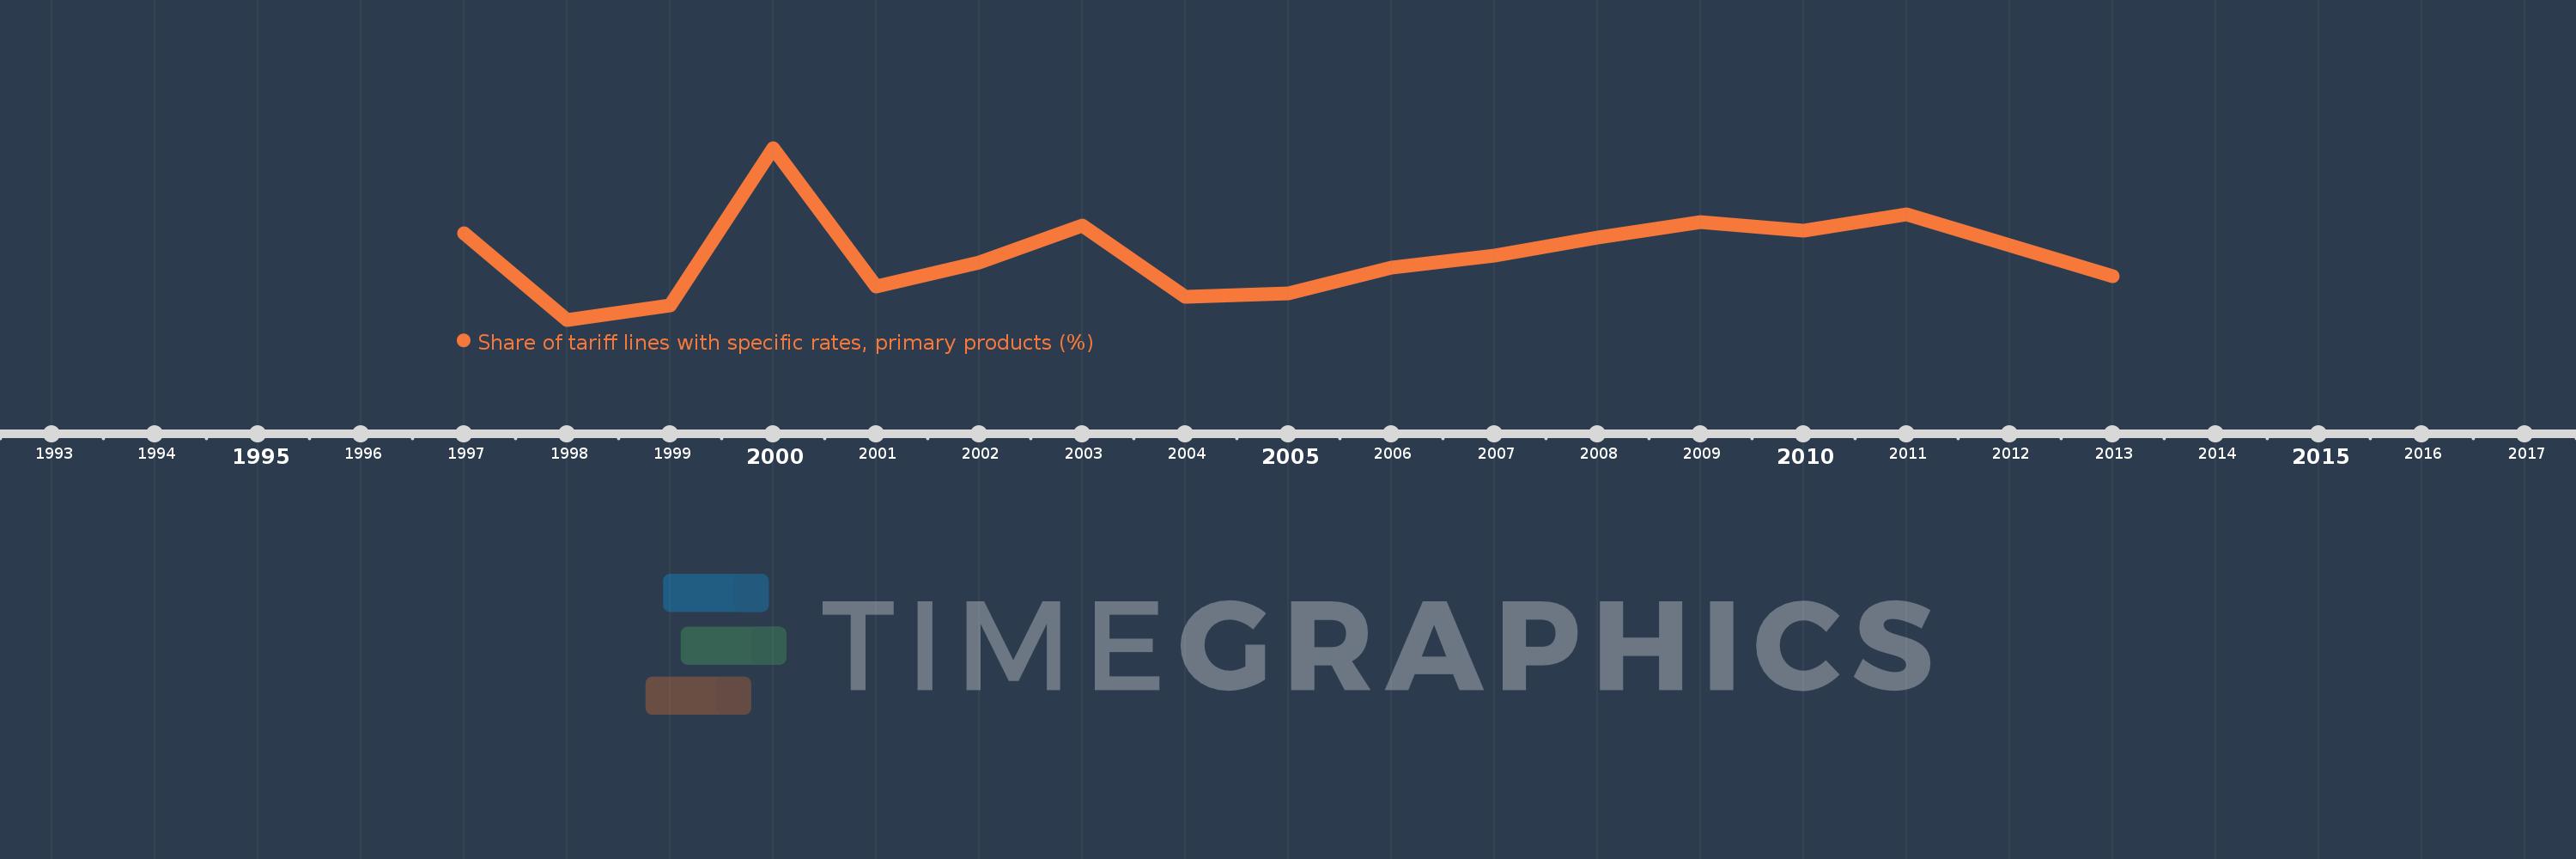
This timeline shows a graph from 1997 to 2013 of Middle income. No data until 1996. Number of actual observations by date: 16.
Source name:
World Development Indicators
Source organization:
World Bank staff estimates using the World Integrated Trade Solution system, based on data from United Nations Conference on Trade and Development's Trade Analysis and Information System (TRAINS) database.
Categories, topics:
Private Sector, Trade
Last updated:
apr 23, 2017
Indicators value changes by year
Meaning:
5.693
Minimum:
0.904
jan 1, 1998
Maximum:
13.528
jan 1, 2000
At the date of observation
Value
Absolute change
Change from the previous value
jan 1, 1997
7.283
+7.283
0.0%
jan 1, 1998
0.904
-6.379
-87.59%
jan 1, 1999
1.975
+1.071
118.56%
jan 1, 2000
13.528
+11.553
585.04%
jan 1, 2001
3.352
-10.176
-75.22%
jan 1, 2002
5.093
+1.741
51.94%
jan 1, 2003
7.842
+2.75
53.99%
jan 1, 2004
2.598
-5.245
-66.87%
jan 1, 2005
2.866
+0.268
10.33%
jan 1, 2006
4.723
+1.857
64.79%
jan 1, 2007
5.627
+0.904
19.13%
jan 1, 2008
6.974
+1.347
23.93%
jan 1, 2009
8.092
+1.118
16.03%
jan 1, 2010
7.478
-0.613
-7.58%
jan 1, 2011
8.657
+1.178
15.76%
jan 1, 2013
4.09
-4.567
-52.76%
Ranking of countries by current statistics by years