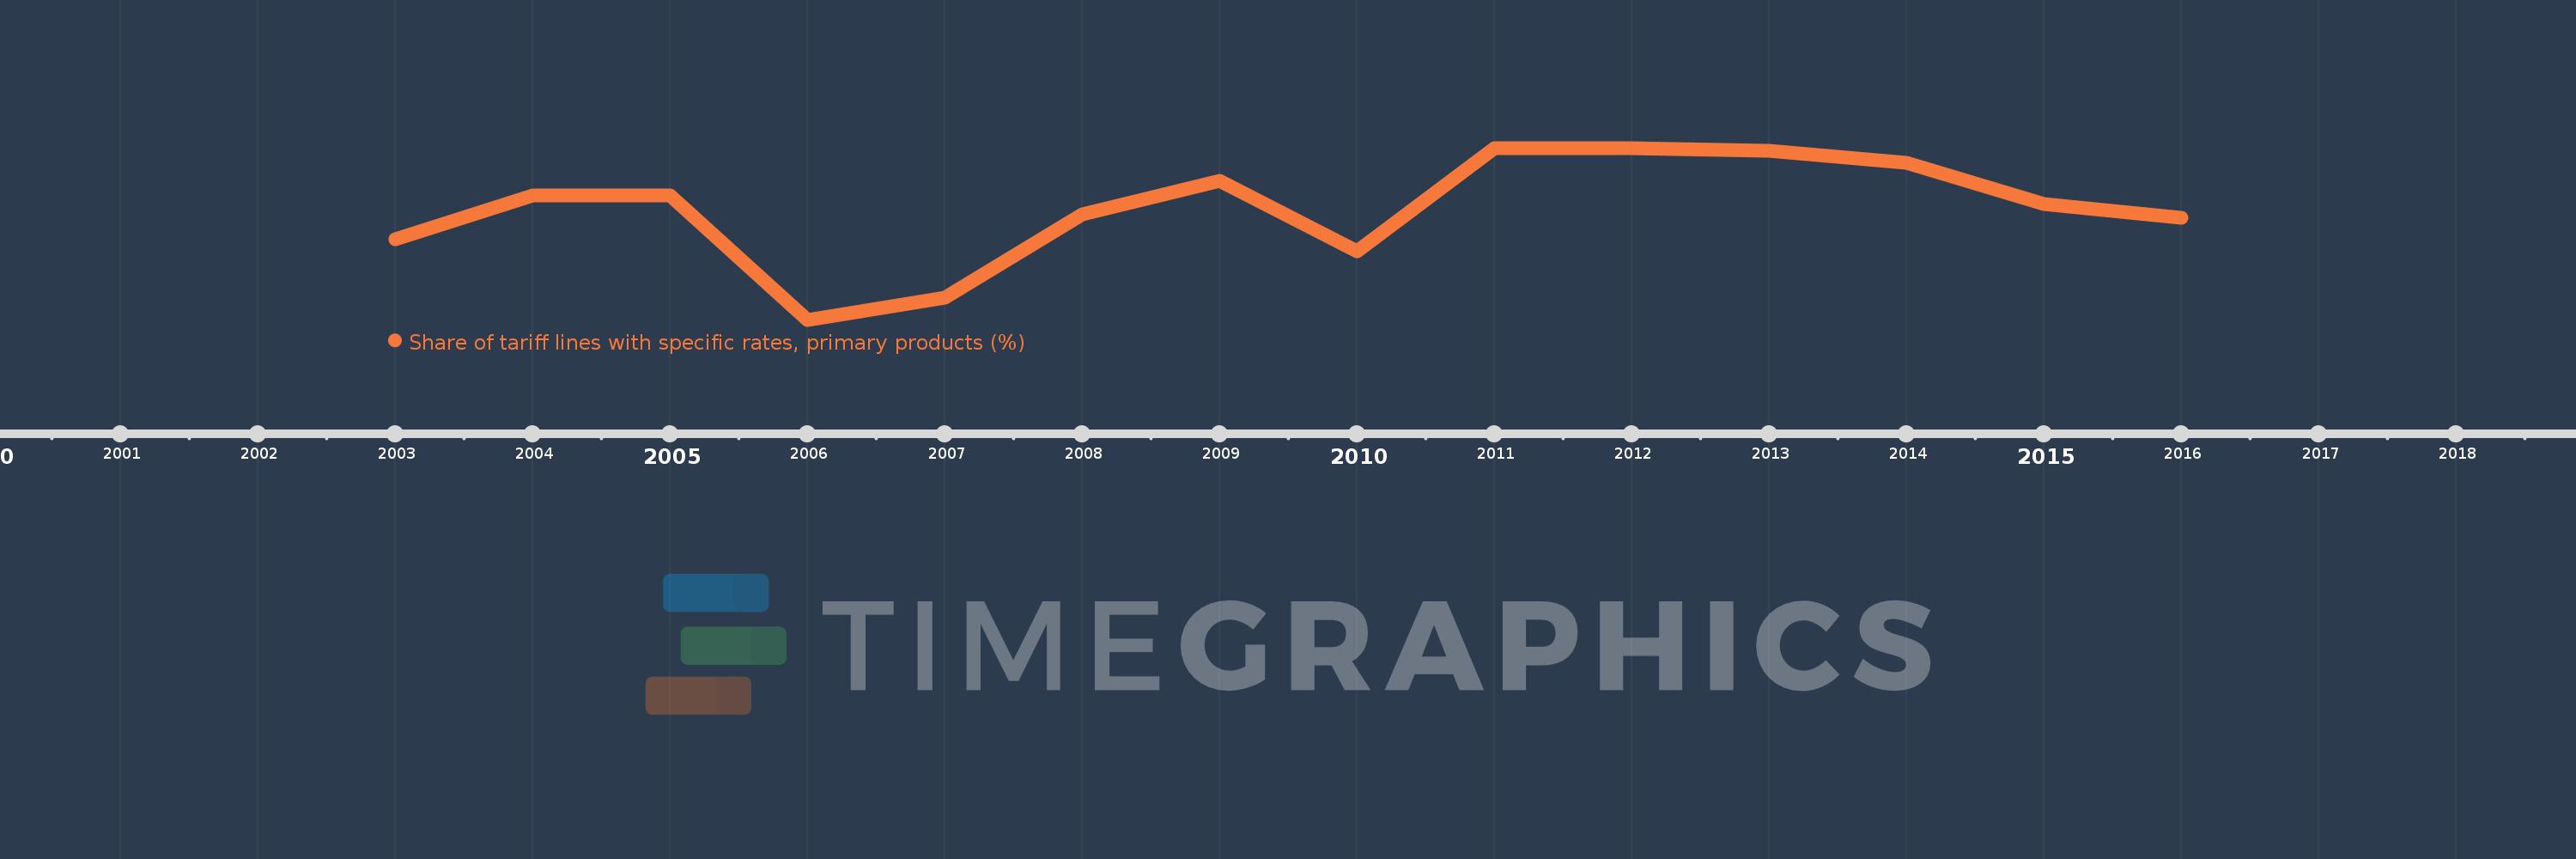
This timeline shows a graph from 2003 to 2016 of Kuwait. No data until 2002. Number of actual observations by date: 14.
Source name:
World Development Indicators
Source organization:
World Bank staff estimates using the World Integrated Trade Solution system, based on data from United Nations Conference on Trade and Development's Trade Analysis and Information System (TRAINS) database.
Categories, topics:
Private Sector, Trade
Last updated:
apr 23, 2017
Indicators value changes by year
Meaning:
1.391
Minimum:
0.472
jan 1, 2006
Maximum:
1.896
jan 1, 2011
At the date of observation
Value
Absolute change
Change from the previous value
jan 1, 2003
1.139
+1.139
0.0%
jan 1, 2004
1.504
+0.364
31.95%
jan 1, 2005
1.504
0.0
0.0%
jan 1, 2006
0.472
-1.031
-68.58%
jan 1, 2007
0.653
+0.181
38.29%
jan 1, 2008
1.346
+0.693
106.07%
jan 1, 2009
1.625
+0.278
20.68%
jan 1, 2010
1.041
-0.583
-35.91%
jan 1, 2011
1.896
+0.855
82.14%
jan 1, 2012
1.896
0.0
0.0%
jan 1, 2013
1.875
-0.021
-1.1%
jan 1, 2014
1.773
-0.102
-5.44%
jan 1, 2015
1.429
-0.344
-19.41%
jan 1, 2016
1.318
-0.111
-7.75%
Ranking of countries by current statistics by years