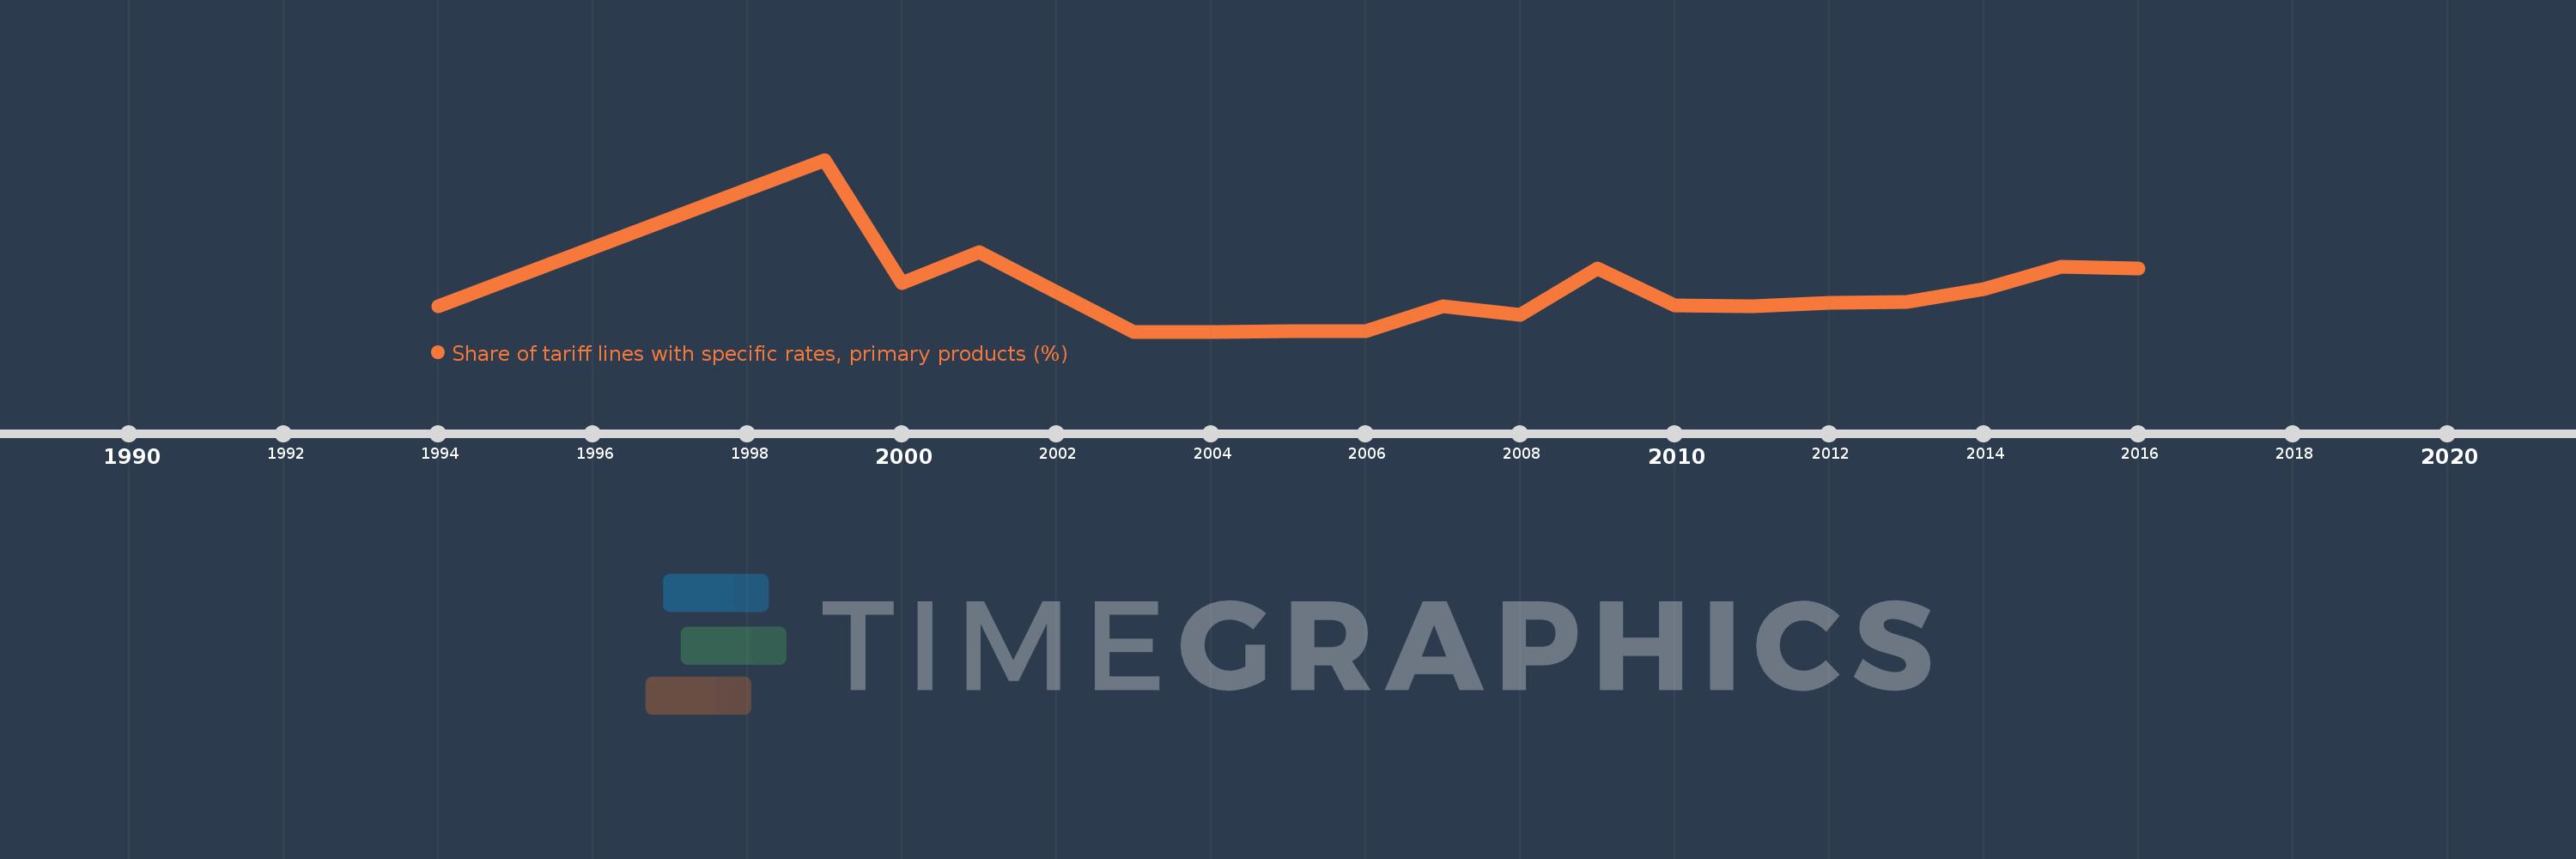
This timeline shows a graph from 1994 to 2016 of Nepal. No data until 1993. Number of actual observations by date: 18.
Source name:
World Development Indicators
Source organization:
World Bank staff estimates using the World Integrated Trade Solution system, based on data from United Nations Conference on Trade and Development's Trade Analysis and Information System (TRAINS) database.
Categories, topics:
Private Sector, Trade
Last updated:
apr 23, 2017
Indicators value changes by year
Meaning:
8.514
Minimum:
3.325
jan 1, 2003
Maximum:
25.833
jan 1, 1999
At the date of observation
Value
Absolute change
Change from the previous value
jan 1, 1994
6.701
+6.701
0.0%
jan 1, 1999
25.833
+19.132
285.51%
jan 1, 2000
9.722
-16.111
-62.37%
jan 1, 2001
13.756
+4.034
41.49%
jan 1, 2003
3.325
-10.431
-75.83%
jan 1, 2004
3.325
0.0
0.0%
jan 1, 2005
3.411
+0.086
2.6%
jan 1, 2006
3.389
-0.022
-0.64%
jan 1, 2007
6.664
+3.275
96.64%
jan 1, 2008
5.493
-1.171
-17.57%
jan 1, 2009
11.595
+6.101
111.07%
jan 1, 2010
6.726
-4.868
-41.99%
jan 1, 2011
6.691
-0.036
-0.53%
jan 1, 2012
7.089
+0.398
5.95%
jan 1, 2013
7.179
+0.09
1.27%
jan 1, 2014
8.858
+1.678
23.38%
jan 1, 2015
11.846
+2.989
33.74%
jan 1, 2016
11.641
-0.205
-1.73%
Ranking of countries by current statistics by years