29
/
en
AIzaSyAYiBZKx7MnpbEhh9jyipgxe19OcubqV5w
April 1, 2024
188492
Malaysia
MYS
true
2
1
Share of tariff lines with specific rates, primary products (%)
2015,2014,2013,2012,2011,2010,2009,2008,2007,2006,2005,2004,2003,2002,2001,1998,1997,1994,1992,1989
Download
Global statistics library →Malaysia →

Share of tariff lines with specific rates, primary products (%)

This statistics in other country:
AfghanistanAlbaniaAlgeriaAngolaAntigua and BarbudaArgentinaArmeniaArubaAustraliaAustriaAzerbaijanBahamas, TheBahrainBangladeshBarbadosBelarusBelgiumBelizeBeninBermudaBhutanBoliviaBosnia and HerzegovinaBotswanaBrazilBrunei DarussalamBulgariaBurkina FasoBurundiCabo VerdeCambodiaCameroonCanadaCentral African RepublicChadChileChinaColombiaComorosCongo, Dem. Rep.Congo, Rep.Costa RicaCote d'IvoireCroatiaCubaCyprusCzech RepublicDenmarkDjiboutiDominicaDominican RepublicEast Asia & Pacific (excluding high income)EcuadorEgypt, Arab Rep.El SalvadorEquatorial GuineaEritreaEstoniaEthiopiaEurope & Central Asia (excluding high income)European UnionFijiFinlandFranceFrench PolynesiaGabonGambia, TheGeorgiaGermanyGhanaGreeceGrenadaGuatemalaGuineaGuinea-BissauGuyanaHaitiHigh incomeHondurasHong Kong SAR, ChinaHungaryIcelandIndiaIndonesiaIran, Islamic Rep.IrelandIsraelItalyJamaicaJapanJordanKazakhstanKenyaKorea, Rep.KuwaitKyrgyz RepublicLao PDRLatin America & Caribbean (excluding high income)LatviaLebanonLesothoLiberiaLibyaLithuaniaLow & middle incomeLow incomeLower middle incomeLuxembourgMacao SAR, ChinaMacedonia, FYRMadagascarMalawiMalaysiaMaldivesMaliMaltaMauritaniaMauritiusMexicoMiddle East & North Africa (excluding high income)Middle incomeMoldovaMongoliaMontenegroMoroccoMozambiqueMyanmarNamibiaNepalNetherlandsNew ZealandNicaraguaNigerNigeriaNorwayOECD membersOmanPakistanPalauPanamaPapua New GuineaParaguayPeruPhilippinesPolandPortugalQatarRomaniaRussian FederationRwandaSamoaSaudi ArabiaSenegalSerbiaSeychellesSierra LeoneSingaporeSlovak RepublicSloveniaSolomon IslandsSouth AfricaSouth AsiaSpainSri LankaSt. Kitts and NevisSt. LuciaSt. Vincent and the GrenadinesSub-Saharan Africa (excluding high income)SudanSurinameSwazilandSwedenSwitzerlandSyrian Arab RepublicTajikistanTanzaniaThailandTimor-LesteTogoTongaTrinidad and TobagoTunisiaTurkeyTurkmenistanTuvaluUgandaUkraineUnited Arab EmiratesUnited KingdomUnited StatesUpper middle incomeUruguayUzbekistanVanuatuVenezuela, RBVietnamWorldYemen, Rep.ZambiaZimbabwe
Timeline:
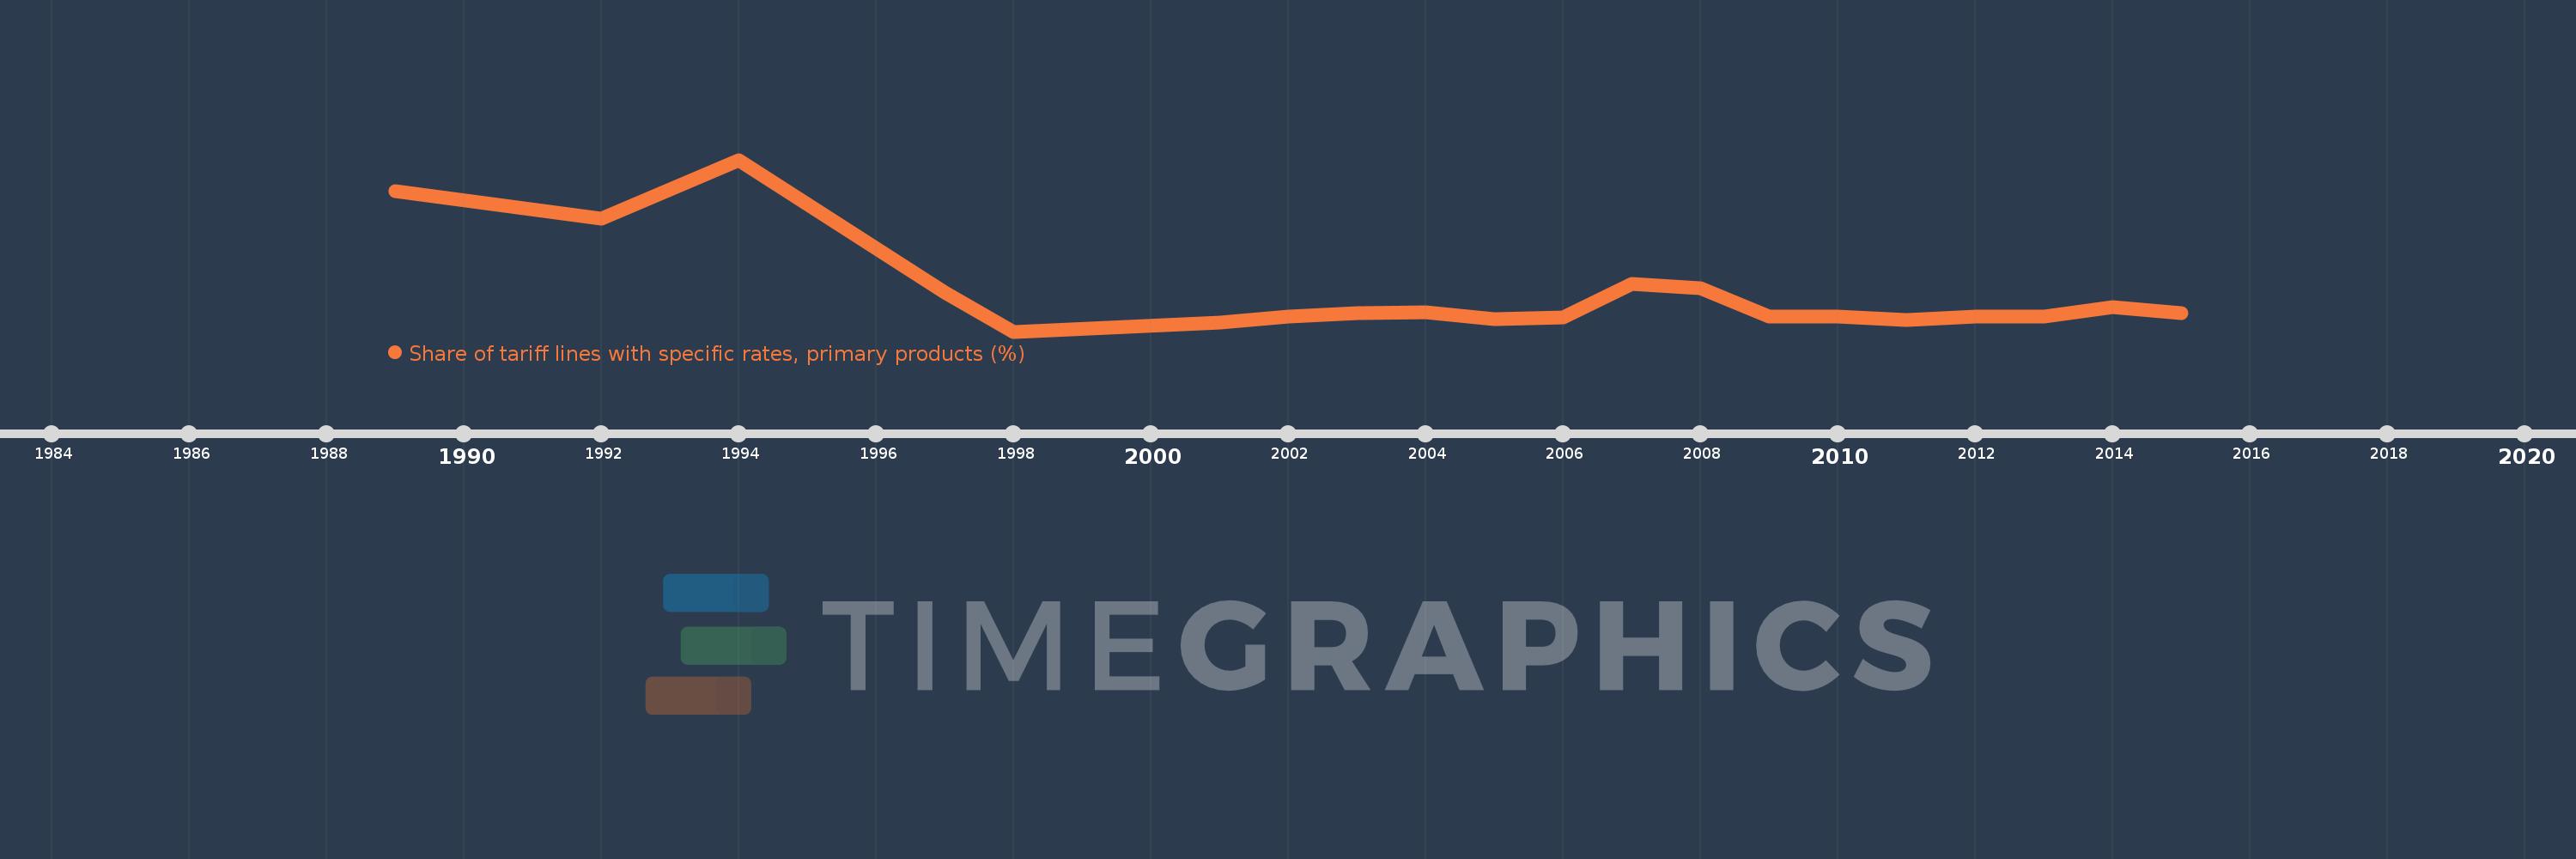
This timeline shows a graph from 1989 to 2015 of Malaysia. No data until 1988. Number of actual observations by date: 20.
Source name:
World Development Indicators
Source organization:
World Bank staff estimates using the World Integrated Trade Solution system, based on data from United Nations Conference on Trade and Development's Trade Analysis and Information System (TRAINS) database.
Categories, topics:
Private Sector, Trade
Last updated:
apr 23, 2017
Indicators value changes by year
Mean:
4.421
Minimum:
0.37
jan 1, 1998
Maximum:
18.773
jan 1, 1994
At the date of observation
Value
Absolute change
Change from previous value
jan 1, 1989
15.376
+15.376
0.0%
jan 1, 1992
12.475
-2.901
-18.87%
jan 1, 1994
18.773
+6.298
50.48%
jan 1, 1997
4.561
-14.212
-75.71%
jan 1, 1998
0.37
-4.19
-91.88%
jan 1, 2001
1.324
+0.954
257.42%
jan 1, 2002
1.997
+0.673
50.83%
jan 1, 2003
2.31
+0.313
15.69%
jan 1, 2004
2.405
+0.095
4.11%
jan 1, 2005
1.687
-0.718
-29.87%
jan 1, 2006
1.861
+0.174
10.34%
jan 1, 2007
5.474
+3.613
194.13%
jan 1, 2008
4.984
-0.49
-8.95%
jan 1, 2009
2.005
-2.979
-59.77%
jan 1, 2010
1.955
-0.05
-2.51%
jan 1, 2011
1.576
-0.379
-19.37%
jan 1, 2012
1.995
+0.419
26.56%
jan 1, 2013
1.997
+0.003
0.13%
jan 1, 2014
2.963
+0.966
48.34%
jan 1, 2015
2.331
-0.632
-21.32%
Ranking of countries by current statistics by years

Comments:

Send
PremiumAbout & FeedbackTermsPrivacy
logo
© 2022 Selected Technologies LLC – Morgan Hill, California