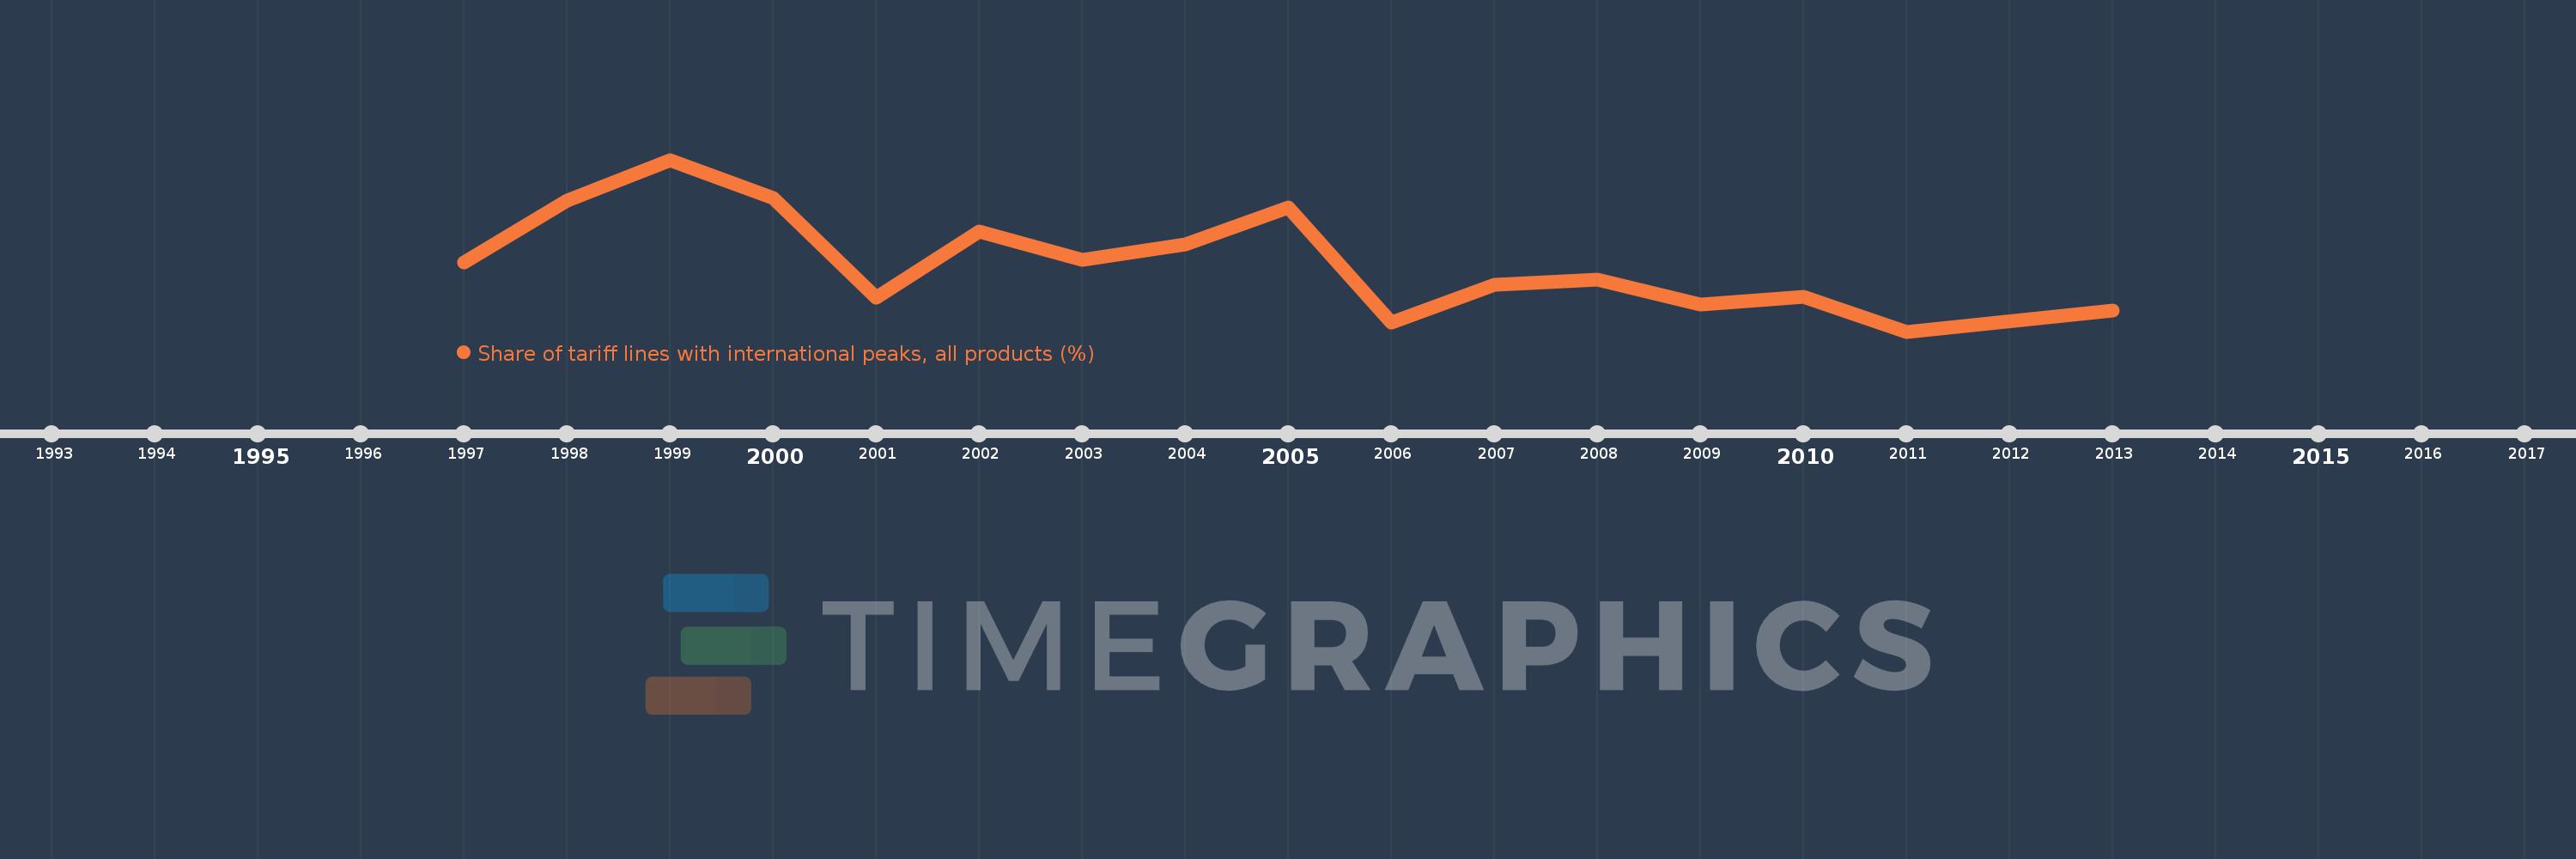
This timeline shows a graph from 1997 to 2013 of South Asia. No data until 1996. Number of actual observations by date: 16.
Source name:
World Development Indicators
Source organization:
World Bank staff estimates using the World Integrated Trade Solution system, based on data from United Nations Conference on Trade and Development's Trade Analysis and Information System (TRAINS) database.
Categories, topics:
Private Sector, Trade
Last updated:
apr 23, 2017
Indicators value changes by year
Meaning:
50.714
Minimum:
28.586
jan 1, 2011
Maximum:
83.175
jan 1, 1999
At the date of observation
Value
Absolute change
Change from the previous value
jan 1, 1997
50.638
+50.638
0.0%
jan 1, 1998
70.193
+19.555
38.62%
jan 1, 1999
83.175
+12.982
18.49%
jan 1, 2000
70.984
-12.191
-14.66%
jan 1, 2001
39.481
-31.503
-44.38%
jan 1, 2002
60.399
+20.918
52.98%
jan 1, 2003
51.503
-8.896
-14.73%
jan 1, 2004
56.403
+4.9
9.51%
jan 1, 2005
68.049
+11.646
20.65%
jan 1, 2006
31.461
-36.588
-53.77%
jan 1, 2007
43.436
+11.975
38.06%
jan 1, 2008
45.178
+1.742
4.01%
jan 1, 2009
37.139
-8.039
-17.79%
jan 1, 2010
39.639
+2.5
6.73%
jan 1, 2011
28.586
-11.053
-27.88%
jan 1, 2013
35.169
+6.583
23.03%
Ranking of countries by current statistics by years