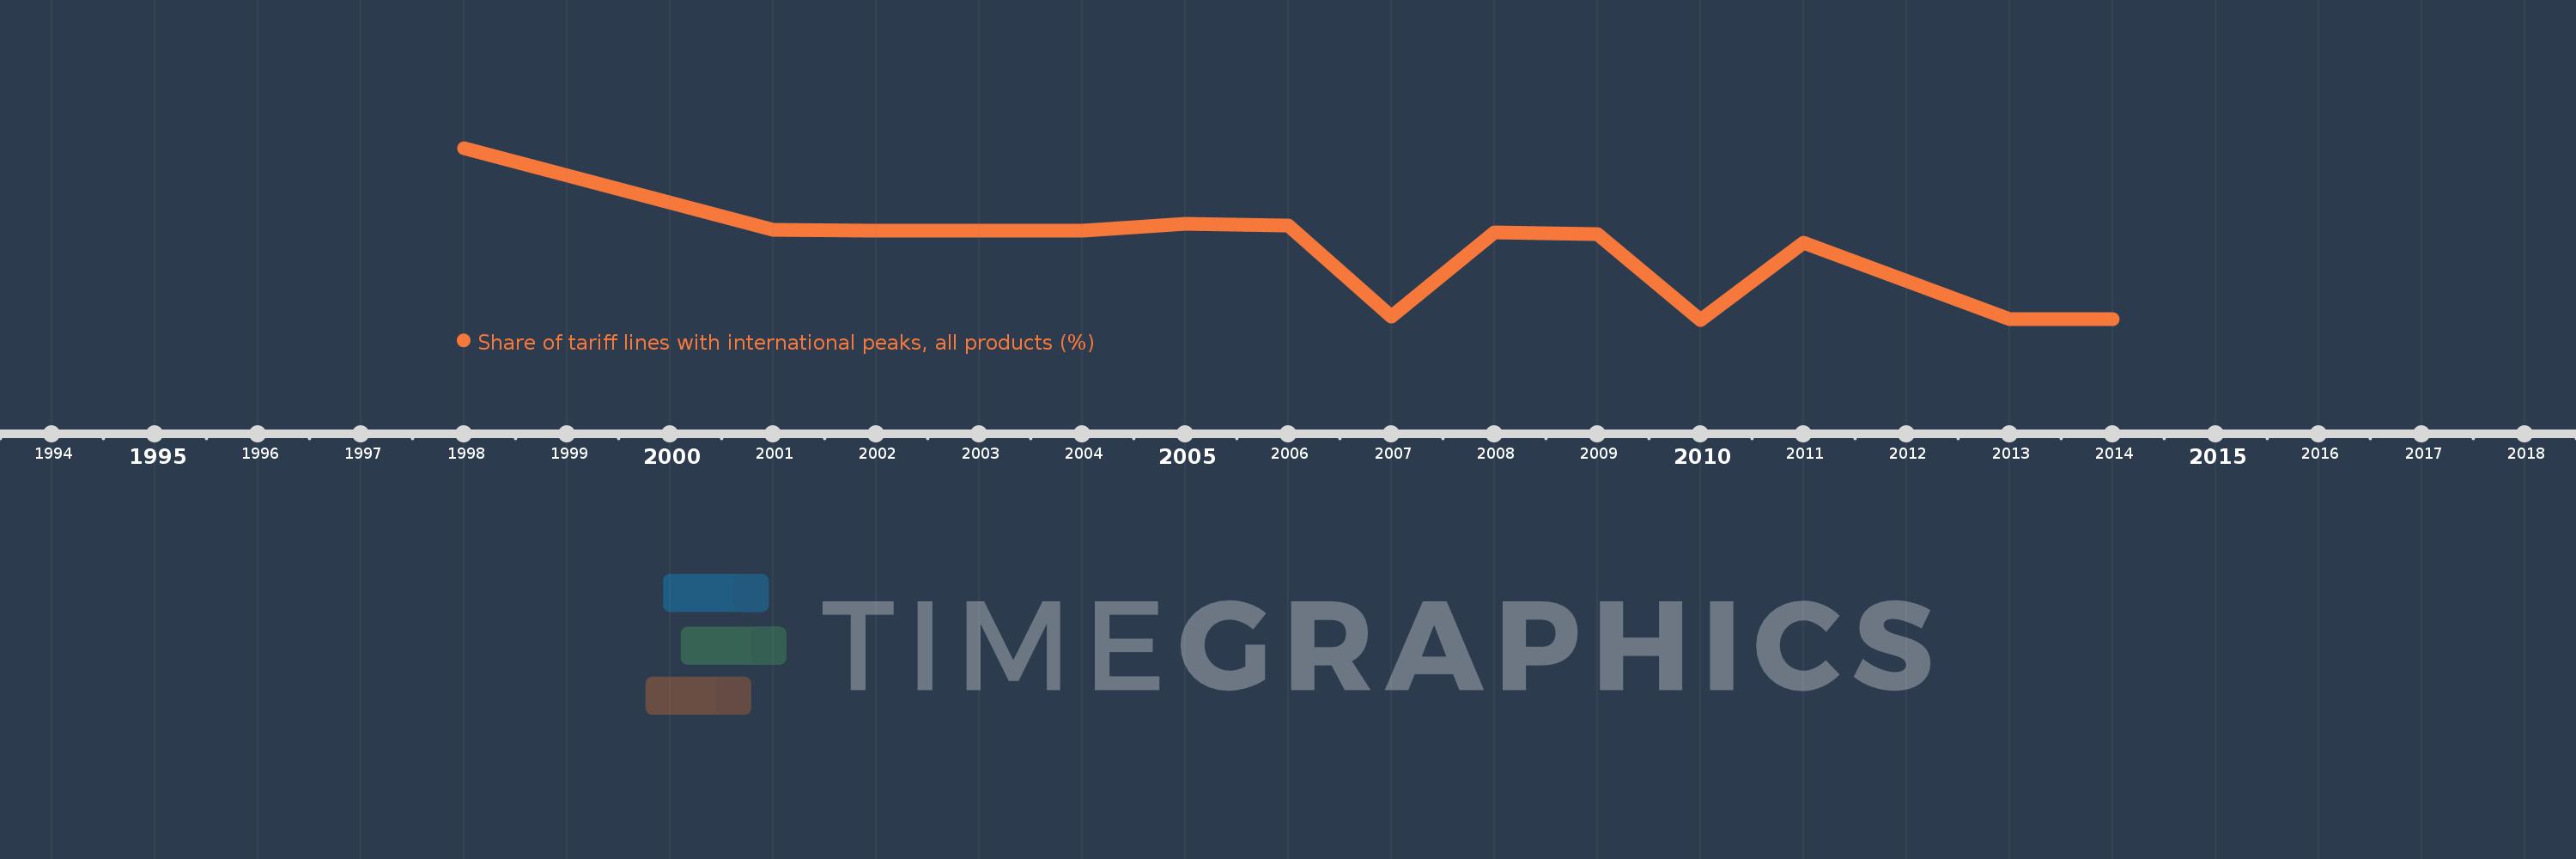
This timeline shows a graph from 1998 to 2014 of Papua New Guinea. No data until 1997. Number of actual observations by date: 14.
Source name:
World Development Indicators
Source organization:
World Bank staff estimates using the World Integrated Trade Solution system, based on data from United Nations Conference on Trade and Development's Trade Analysis and Information System (TRAINS) database.
Categories, topics:
Private Sector, Trade
Last updated:
apr 23, 2017
Indicators value changes by year
Meaning:
22.985
Minimum:
14.937
jan 1, 2010
Maximum:
34.801
jan 1, 1998
At the date of observation
Value
Absolute change
Change from the previous value
jan 1, 1998
34.801
+34.801
0.0%
jan 1, 2001
25.302
-9.499
-27.3%
jan 1, 2002
25.284
-0.018
-0.07%
jan 1, 2003
25.24
-0.044
-0.17%
jan 1, 2004
25.271
+0.031
0.12%
jan 1, 2005
26.076
+0.805
3.19%
jan 1, 2006
25.847
-0.229
-0.88%
jan 1, 2007
15.274
-10.573
-40.91%
jan 1, 2008
25.033
+9.759
63.89%
jan 1, 2009
24.876
-0.157
-0.63%
jan 1, 2010
14.937
-9.939
-39.95%
jan 1, 2011
23.867
+8.93
59.79%
jan 1, 2013
14.991
-8.876
-37.19%
jan 1, 2014
14.991
0.0
0.0%
Ranking of countries by current statistics by years