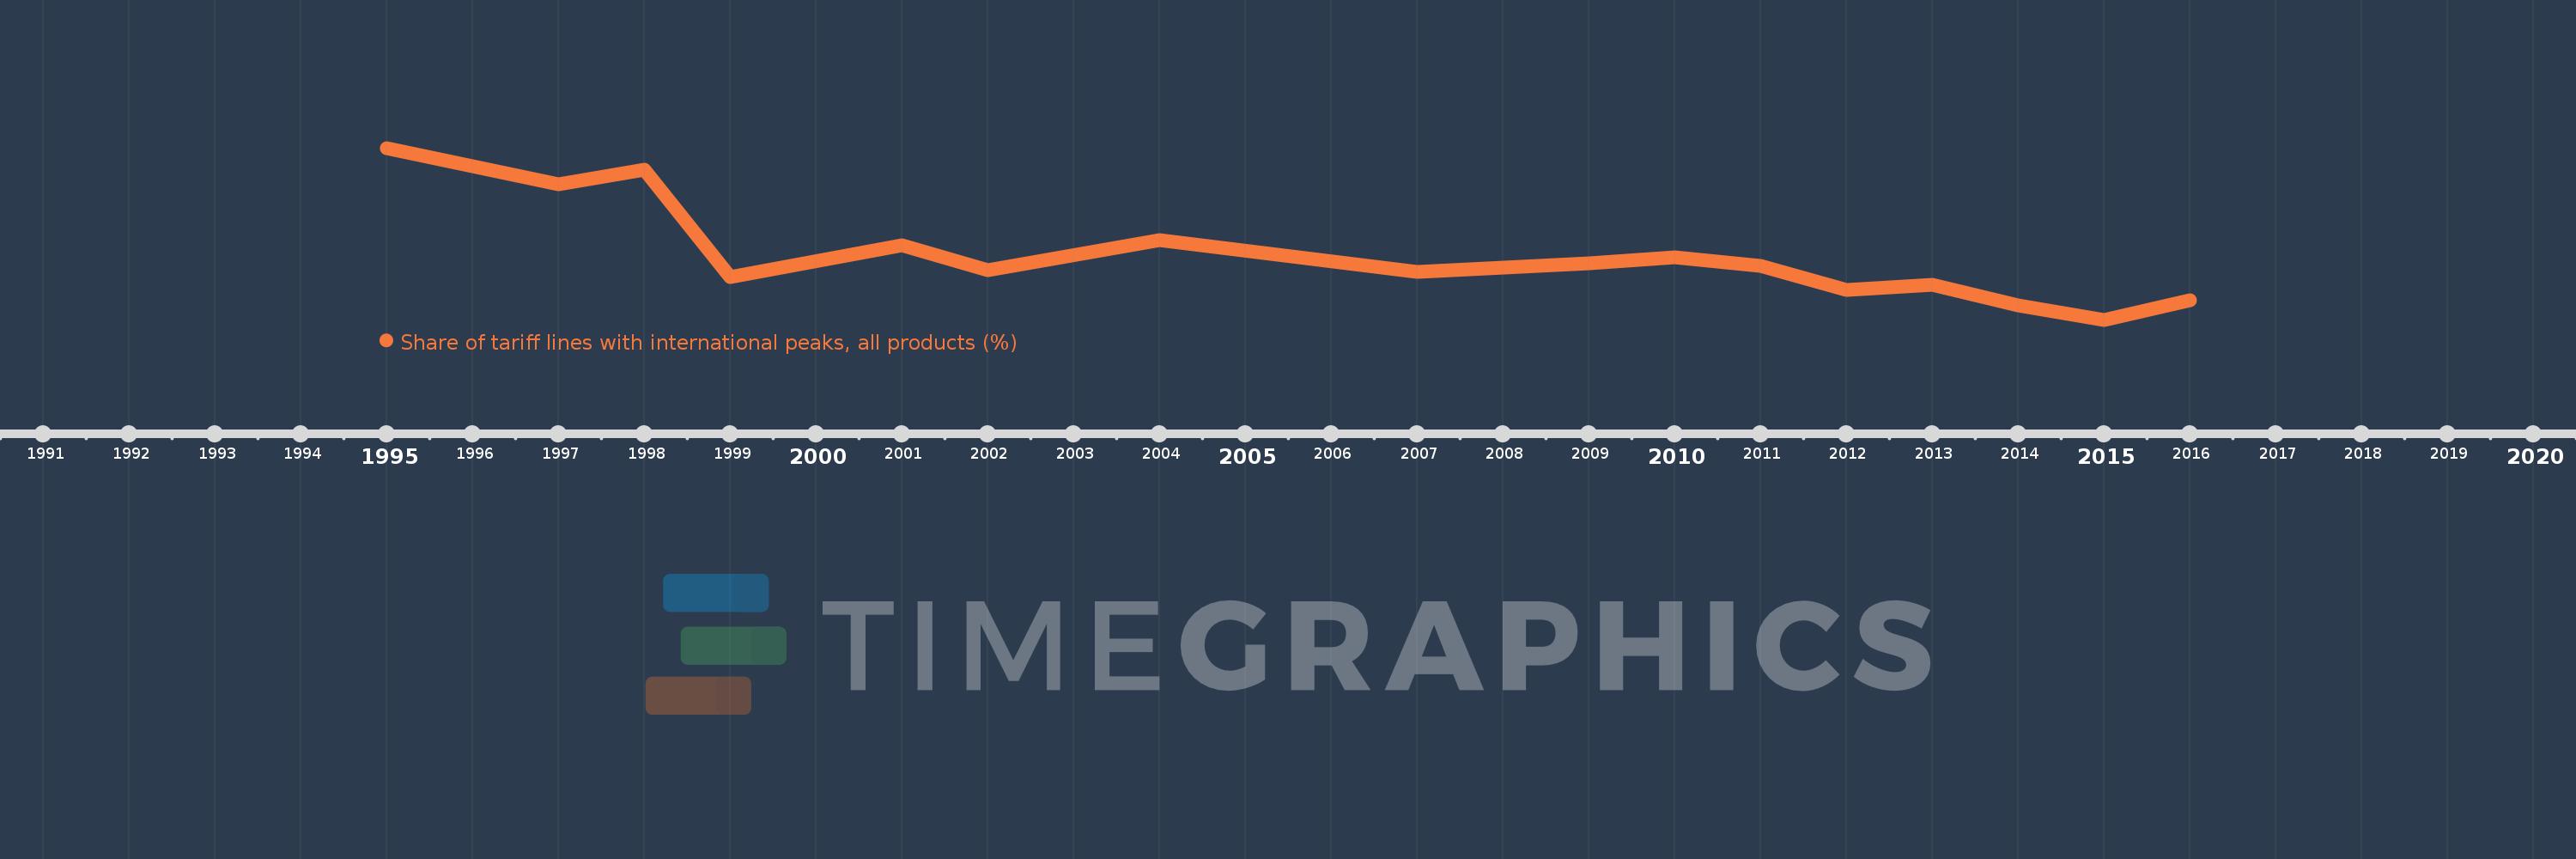
This timeline shows a graph from 1995 to 2016 of Malawi. No data until 1994. Number of actual observations by date: 16.
Source name:
World Development Indicators
Source organization:
World Bank staff estimates using the World Integrated Trade Solution system, based on data from United Nations Conference on Trade and Development's Trade Analysis and Information System (TRAINS) database.
Categories, topics:
Private Sector, Trade
Last updated:
apr 23, 2017
Indicators value changes by year
Meaning:
46.436
Minimum:
22.707
jan 1, 2015
Maximum:
86.528
jan 1, 1995
At the date of observation
Value
Absolute change
Change from the previous value
jan 1, 1995
86.528
+86.528
0.0%
jan 1, 1997
72.911
-13.617
-15.74%
jan 1, 1998
78.595
+5.684
7.8%
jan 1, 1999
38.525
-40.071
-50.98%
jan 1, 2001
50.426
+11.901
30.89%
jan 1, 2002
41.063
-9.363
-18.57%
jan 1, 2004
52.196
+11.133
27.11%
jan 1, 2007
40.377
-11.819
-22.64%
jan 1, 2009
43.824
+3.446
8.54%
jan 1, 2010
45.985
+2.161
4.93%
jan 1, 2011
42.572
-3.413
-7.42%
jan 1, 2012
33.87
-8.701
-20.44%
jan 1, 2013
35.572
+1.701
5.02%
jan 1, 2014
27.932
-7.64
-21.48%
jan 1, 2015
22.707
-5.225
-18.71%
jan 1, 2016
29.887
+7.18
31.62%
Ranking of countries by current statistics by years