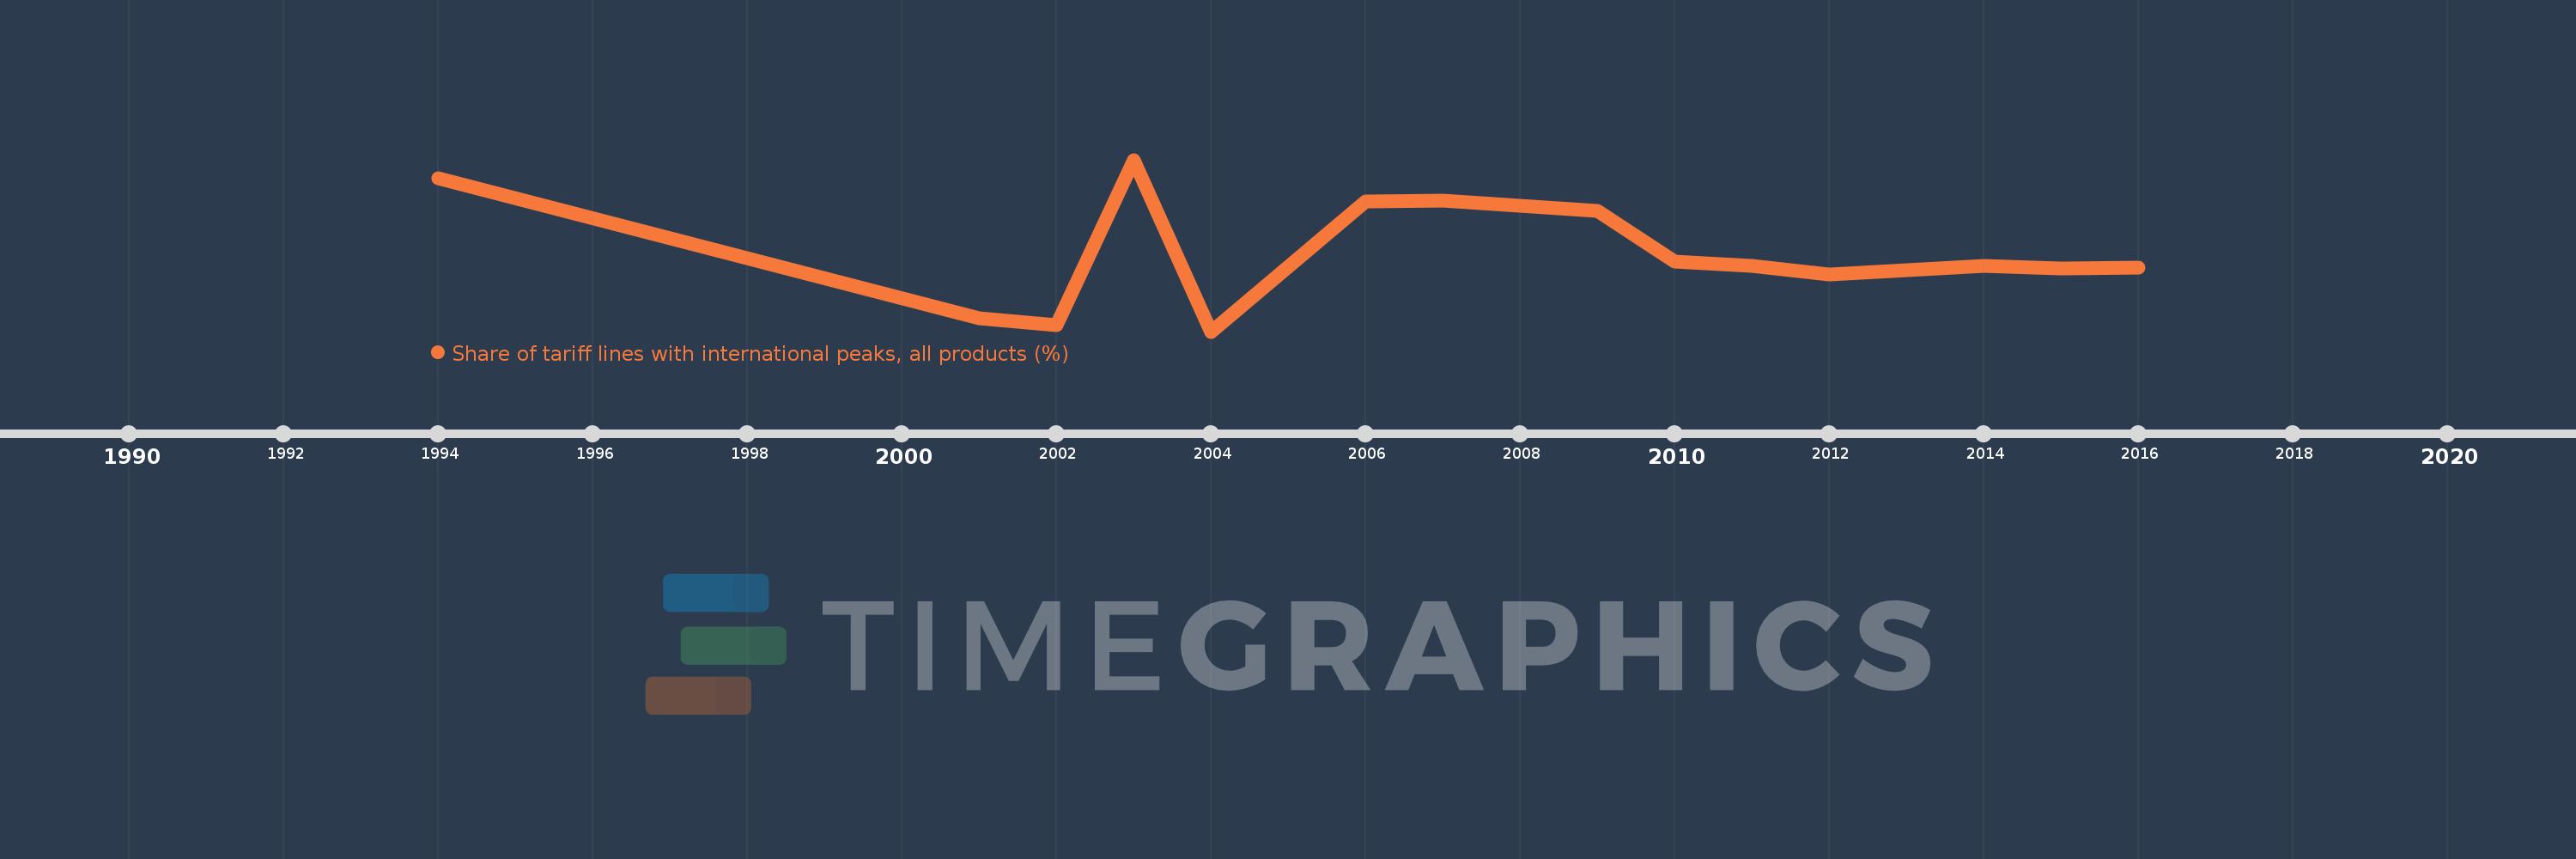
This timeline shows a graph from 1994 to 2016 of Rwanda. No data until 1993. Number of actual observations by date: 15.
Source name:
World Development Indicators
Source organization:
World Bank staff estimates using the World Integrated Trade Solution system, based on data from United Nations Conference on Trade and Development's Trade Analysis and Information System (TRAINS) database.
Categories, topics:
Private Sector, Trade
Last updated:
apr 23, 2017
Indicators value changes by year
Meaning:
38.852
Minimum:
13.082
jan 1, 2004
Maximum:
69.654
jan 1, 2003
At the date of observation
Value
Absolute change
Change from the previous value
jan 1, 1994
63.607
+63.607
0.0%
jan 1, 2001
17.475
-46.132
-72.53%
jan 1, 2002
15.245
-2.23
-12.76%
jan 1, 2003
69.654
+54.409
356.89%
jan 1, 2004
13.082
-56.572
-81.22%
jan 1, 2006
55.903
+42.821
327.33%
jan 1, 2007
56.121
+0.218
0.39%
jan 1, 2009
52.763
-3.358
-5.98%
jan 1, 2010
35.994
-16.769
-31.78%
jan 1, 2011
34.724
-1.27
-3.53%
jan 1, 2012
31.969
-2.756
-7.94%
jan 1, 2013
33.275
+1.306
4.09%
jan 1, 2014
34.701
+1.426
4.29%
jan 1, 2015
33.979
-0.722
-2.08%
jan 1, 2016
34.294
+0.315
0.93%
Ranking of countries by current statistics by years