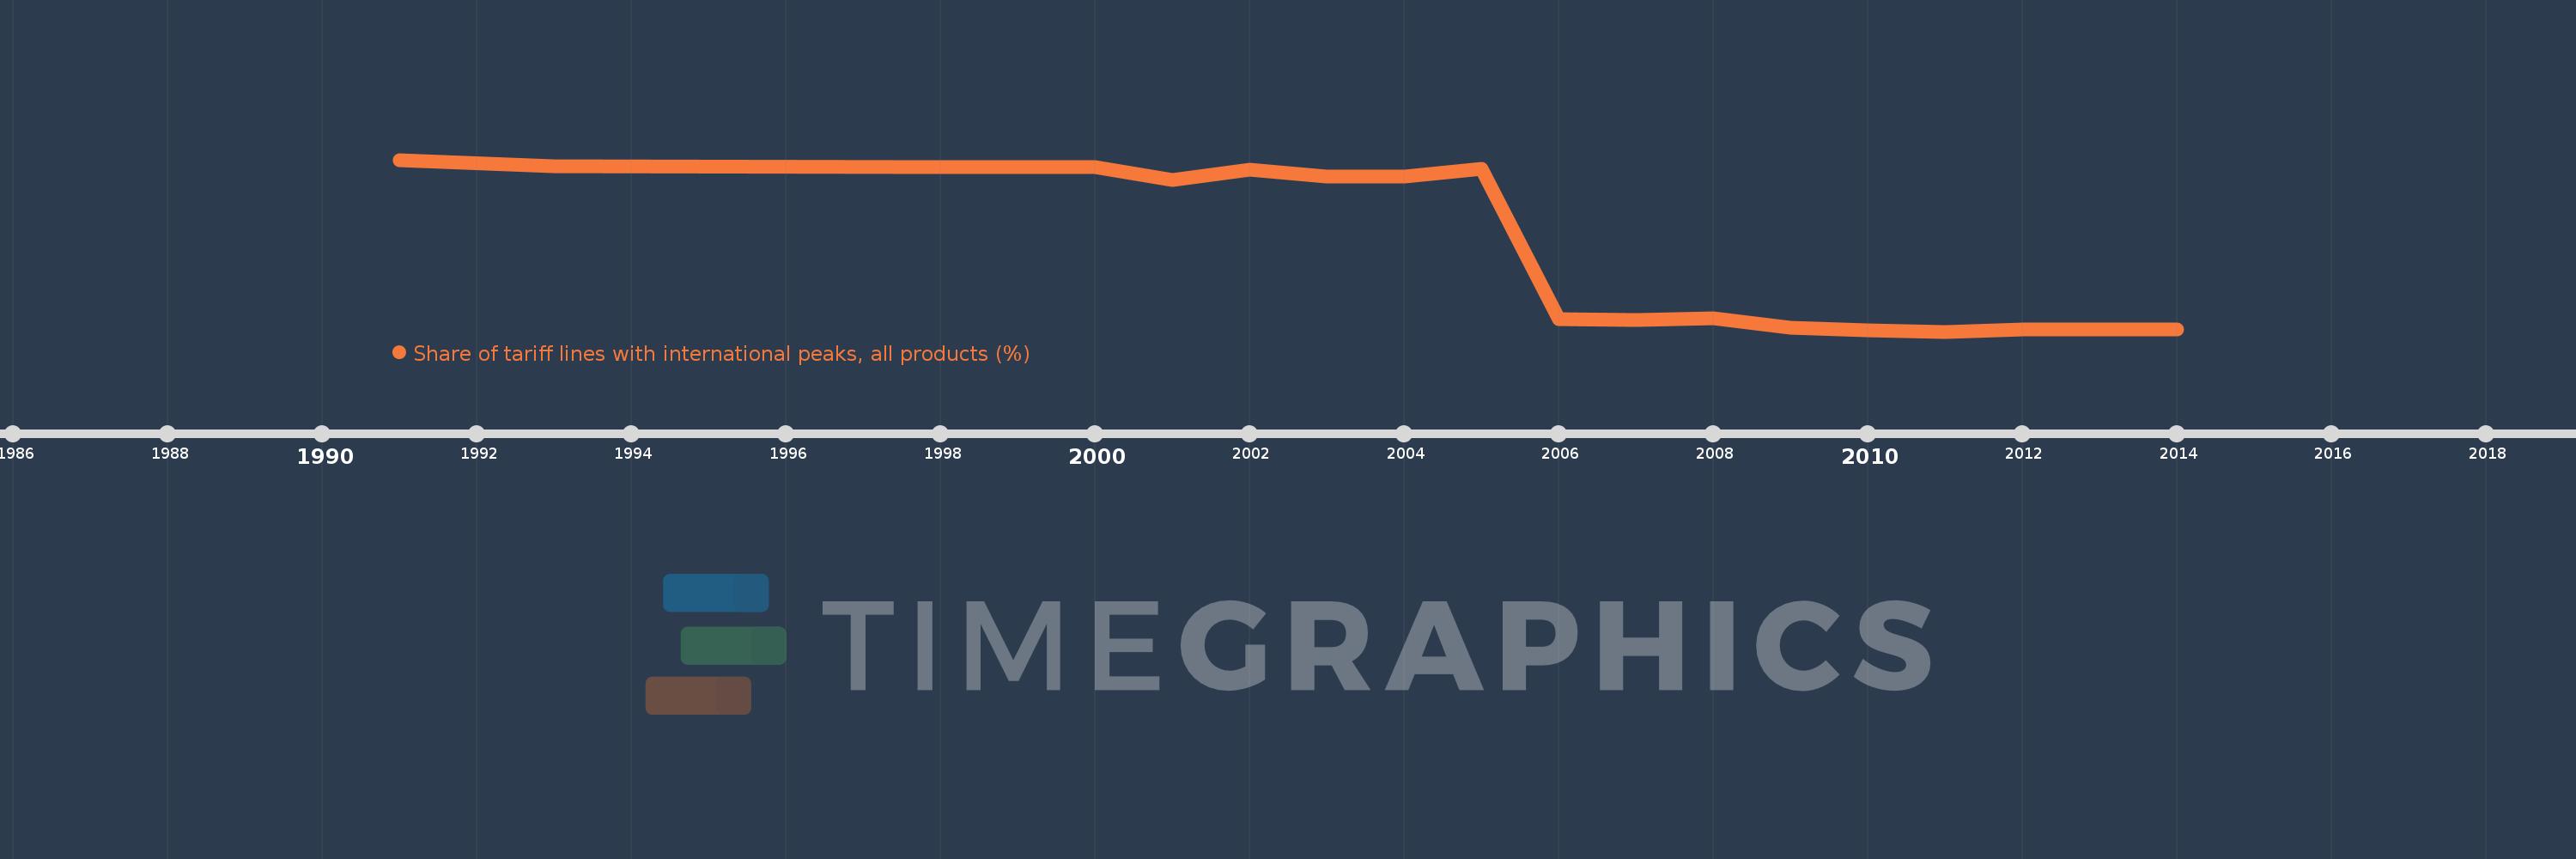
This timeline shows a graph from 1991 to 2014 of India. No data until 1990. Number of actual observations by date: 18.
Source name:
World Development Indicators
Source organization:
World Bank staff estimates using the World Integrated Trade Solution system, based on data from United Nations Conference on Trade and Development's Trade Analysis and Information System (TRAINS) database.
Categories, topics:
Private Sector, Trade
Last updated:
apr 23, 2017
Indicators value changes by year
Meaning:
50.063
Minimum:
5.233
jan 1, 2011
Maximum:
97.632
jan 1, 1991
At the date of observation
Value
Absolute change
Change from the previous value
jan 1, 1991
97.632
+97.632
0.0%
jan 1, 1993
94.371
-3.261
-3.34%
jan 1, 1998
93.784
-0.587
-0.62%
jan 1, 2000
93.571
-0.213
-0.23%
jan 1, 2001
86.644
-6.927
-7.4%
jan 1, 2002
92.135
+5.491
6.34%
jan 1, 2003
88.464
-3.671
-3.98%
jan 1, 2004
88.427
-0.037
-0.04%
jan 1, 2005
92.553
+4.126
4.67%
jan 1, 2006
12.138
-80.416
-86.89%
jan 1, 2007
11.395
-0.743
-6.12%
jan 1, 2008
12.326
+0.931
8.17%
jan 1, 2009
7.12
-5.207
-42.24%
jan 1, 2010
5.96
-1.159
-16.28%
jan 1, 2011
5.233
-0.727
-12.2%
jan 1, 2012
6.295
+1.062
20.3%
jan 1, 2013
6.528
+0.233
3.7%
jan 1, 2014
6.557
+0.029
0.45%
Ranking of countries by current statistics by years