29
/
en
AIzaSyAYiBZKx7MnpbEhh9jyipgxe19OcubqV5w
April 1, 2024
262991
Thailand
THA
true
2
1
Share of tariff lines with international peaks, all products (%)
2016,2015,2014,2012,2011,2010,2009,2008,2007,2006,2005,2004,2002,2001,1996,1994,1992,1990
Download
Global statistics library →Thailand →

Share of tariff lines with international peaks, all products (%)

This statistics in other country:
AfghanistanAlbaniaAlgeriaAngolaAntigua and BarbudaArgentinaArmeniaArubaAustraliaAustriaAzerbaijanBahamas, TheBahrainBangladeshBarbadosBelarusBelgiumBelizeBeninBermudaBhutanBoliviaBosnia and HerzegovinaBotswanaBrazilBrunei DarussalamBulgariaBurkina FasoBurundiCabo VerdeCambodiaCameroonCanadaCentral African RepublicChadChileChinaColombiaComorosCongo, Dem. Rep.Congo, Rep.Costa RicaCote d'IvoireCroatiaCubaCyprusCzech RepublicDenmarkDjiboutiDominicaDominican RepublicEast Asia & Pacific (excluding high income)EcuadorEgypt, Arab Rep.El SalvadorEquatorial GuineaEritreaEstoniaEthiopiaEurope & Central Asia (excluding high income)European UnionFijiFinlandFranceFrench PolynesiaGabonGambia, TheGeorgiaGermanyGhanaGreeceGrenadaGuatemalaGuineaGuinea-BissauGuyanaHaitiHigh incomeHondurasHong Kong SAR, ChinaHungaryIcelandIndiaIndonesiaIran, Islamic Rep.IrelandIsraelItalyJamaicaJapanJordanKazakhstanKenyaKorea, Rep.KuwaitKyrgyz RepublicLao PDRLatin America & Caribbean (excluding high income)LatviaLebanonLesothoLiberiaLibyaLithuaniaLow & middle incomeLow incomeLower middle incomeLuxembourgMacao SAR, ChinaMacedonia, FYRMadagascarMalawiMalaysiaMaldivesMaliMaltaMauritaniaMauritiusMexicoMiddle East & North Africa (excluding high income)Middle incomeMoldovaMongoliaMontenegroMoroccoMozambiqueMyanmarNamibiaNepalNetherlandsNew ZealandNicaraguaNigerNigeriaNorwayOECD membersOmanPakistanPalauPanamaPapua New GuineaParaguayPeruPhilippinesPolandPortugalQatarRomaniaRussian FederationRwandaSamoaSaudi ArabiaSenegalSerbiaSeychellesSierra LeoneSingaporeSlovak RepublicSloveniaSolomon IslandsSouth AfricaSouth AsiaSpainSri LankaSt. Kitts and NevisSt. LuciaSt. Vincent and the GrenadinesSub-Saharan Africa (excluding high income)SudanSurinameSwazilandSwedenSwitzerlandSyrian Arab RepublicTajikistanTanzaniaThailandTimor-LesteTogoTongaTrinidad and TobagoTunisiaTurkeyTurkmenistanTuvaluUgandaUkraineUnited Arab EmiratesUnited KingdomUnited StatesUpper middle incomeUruguayUzbekistanVanuatuVenezuela, RBVietnamWorldYemen, Rep.ZambiaZimbabwe
Timeline:
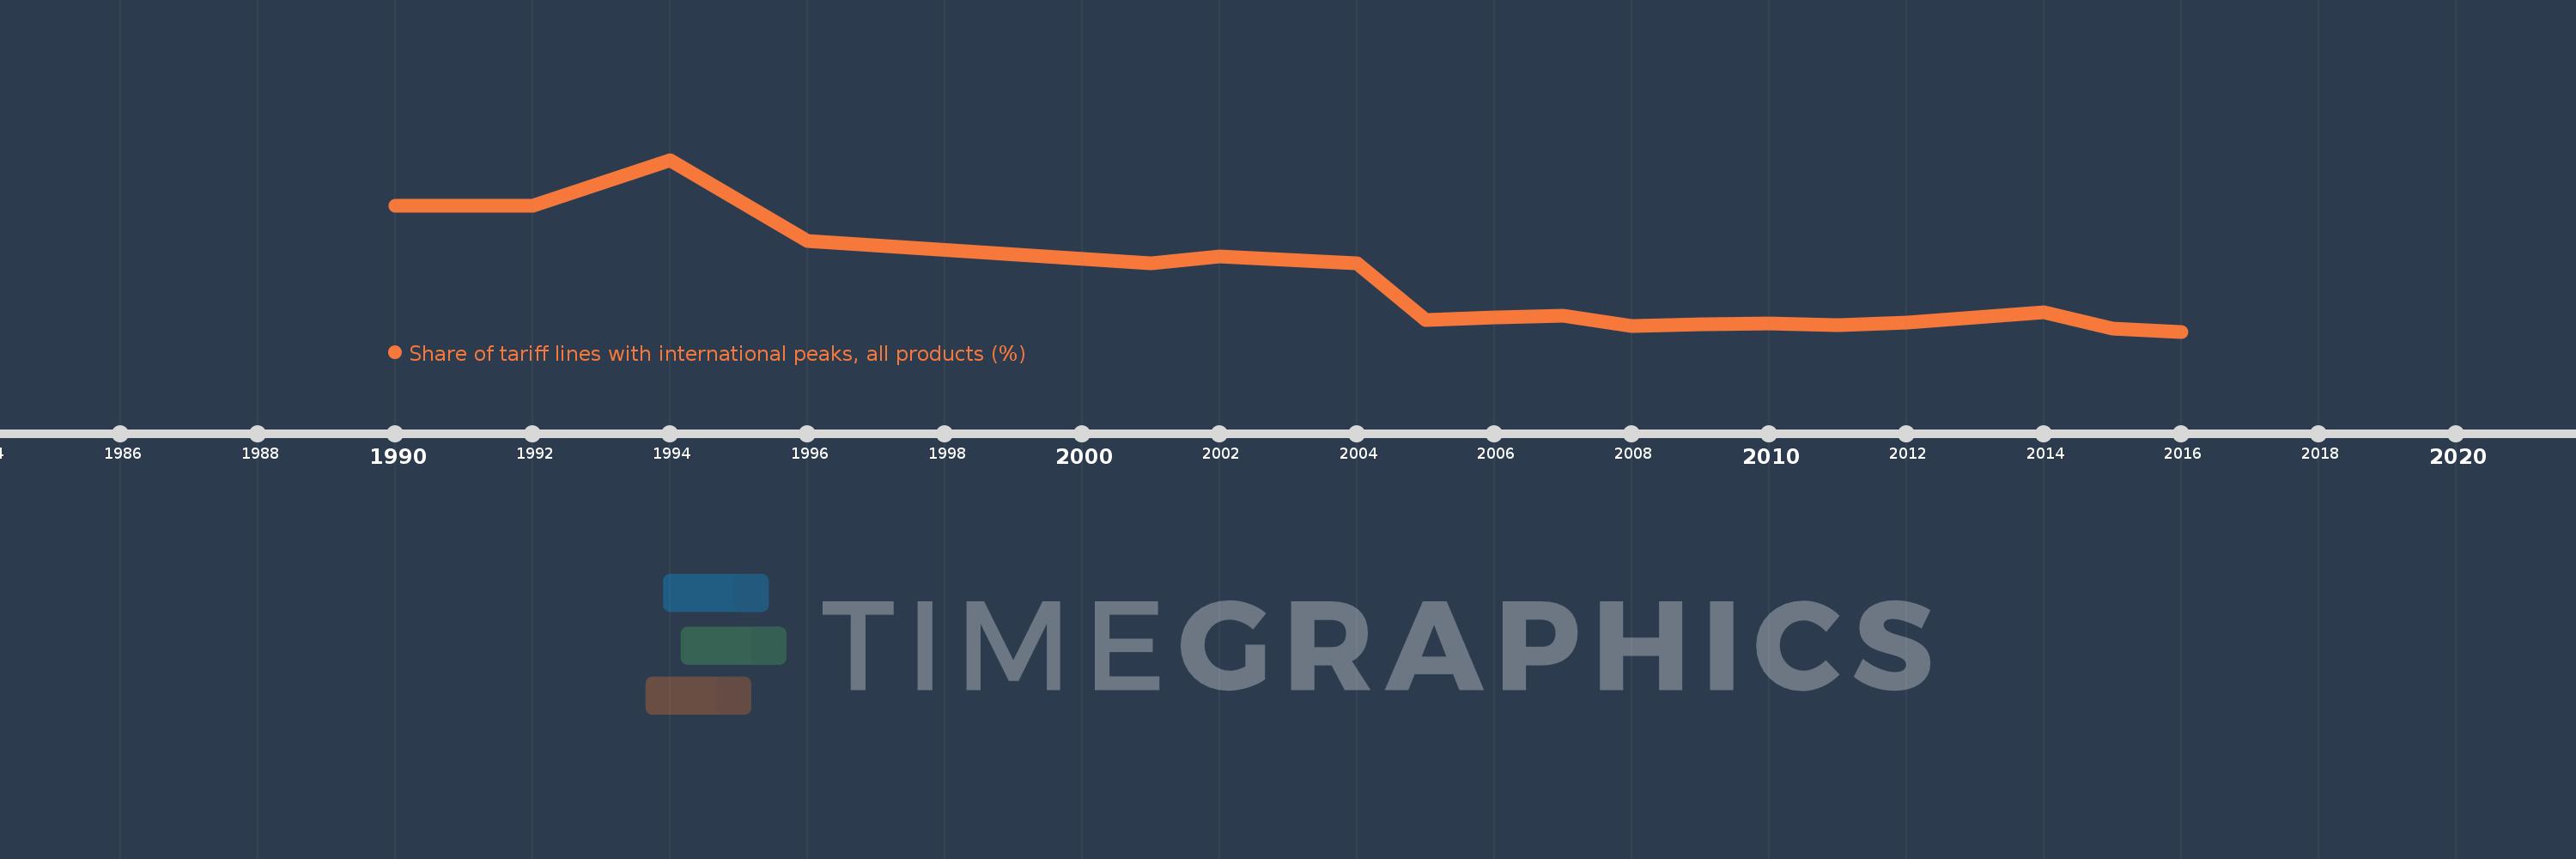
This timeline shows a graph from 1990 to 2016 of Thailand. No data until 1989. Number of actual observations by date: 18.
Source name:
World Development Indicators
Source organization:
World Bank staff estimates using the World Integrated Trade Solution system, based on data from United Nations Conference on Trade and Development's Trade Analysis and Information System (TRAINS) database.
Categories, topics:
Private Sector, Trade
Last updated:
apr 23, 2017
Indicators value changes by year
Mean:
36.561
Minimum:
15.679
jan 1, 2016
Maximum:
93.825
jan 1, 1994
At the date of observation
Value
Absolute change
Change from previous value
jan 1, 1990
72.952
+72.952
0.0%
jan 1, 1992
72.789
-0.162
-0.22%
jan 1, 1994
93.825
+21.036
28.9%
jan 1, 1996
56.982
-36.843
-39.27%
jan 1, 2001
46.715
-10.267
-18.02%
jan 1, 2002
49.738
+3.024
6.47%
jan 1, 2004
46.838
-2.9
-5.83%
jan 1, 2005
21.045
-25.794
-55.07%
jan 1, 2006
21.967
+0.922
4.38%
jan 1, 2007
22.766
+0.799
3.64%
jan 1, 2008
18.408
-4.358
-19.14%
jan 1, 2009
19.065
+0.657
3.57%
jan 1, 2010
19.489
+0.424
2.22%
jan 1, 2011
18.615
-0.874
-4.49%
jan 1, 2012
19.754
+1.139
6.12%
jan 1, 2014
24.53
+4.776
24.18%
jan 1, 2015
16.937
-7.593
-30.95%
jan 1, 2016
15.679
-1.258
-7.43%
Ranking of countries by current statistics by years

Comments:

Send
PremiumAbout & FeedbackTermsPrivacy
logo
© 2022 Selected Technologies LLC – Morgan Hill, California