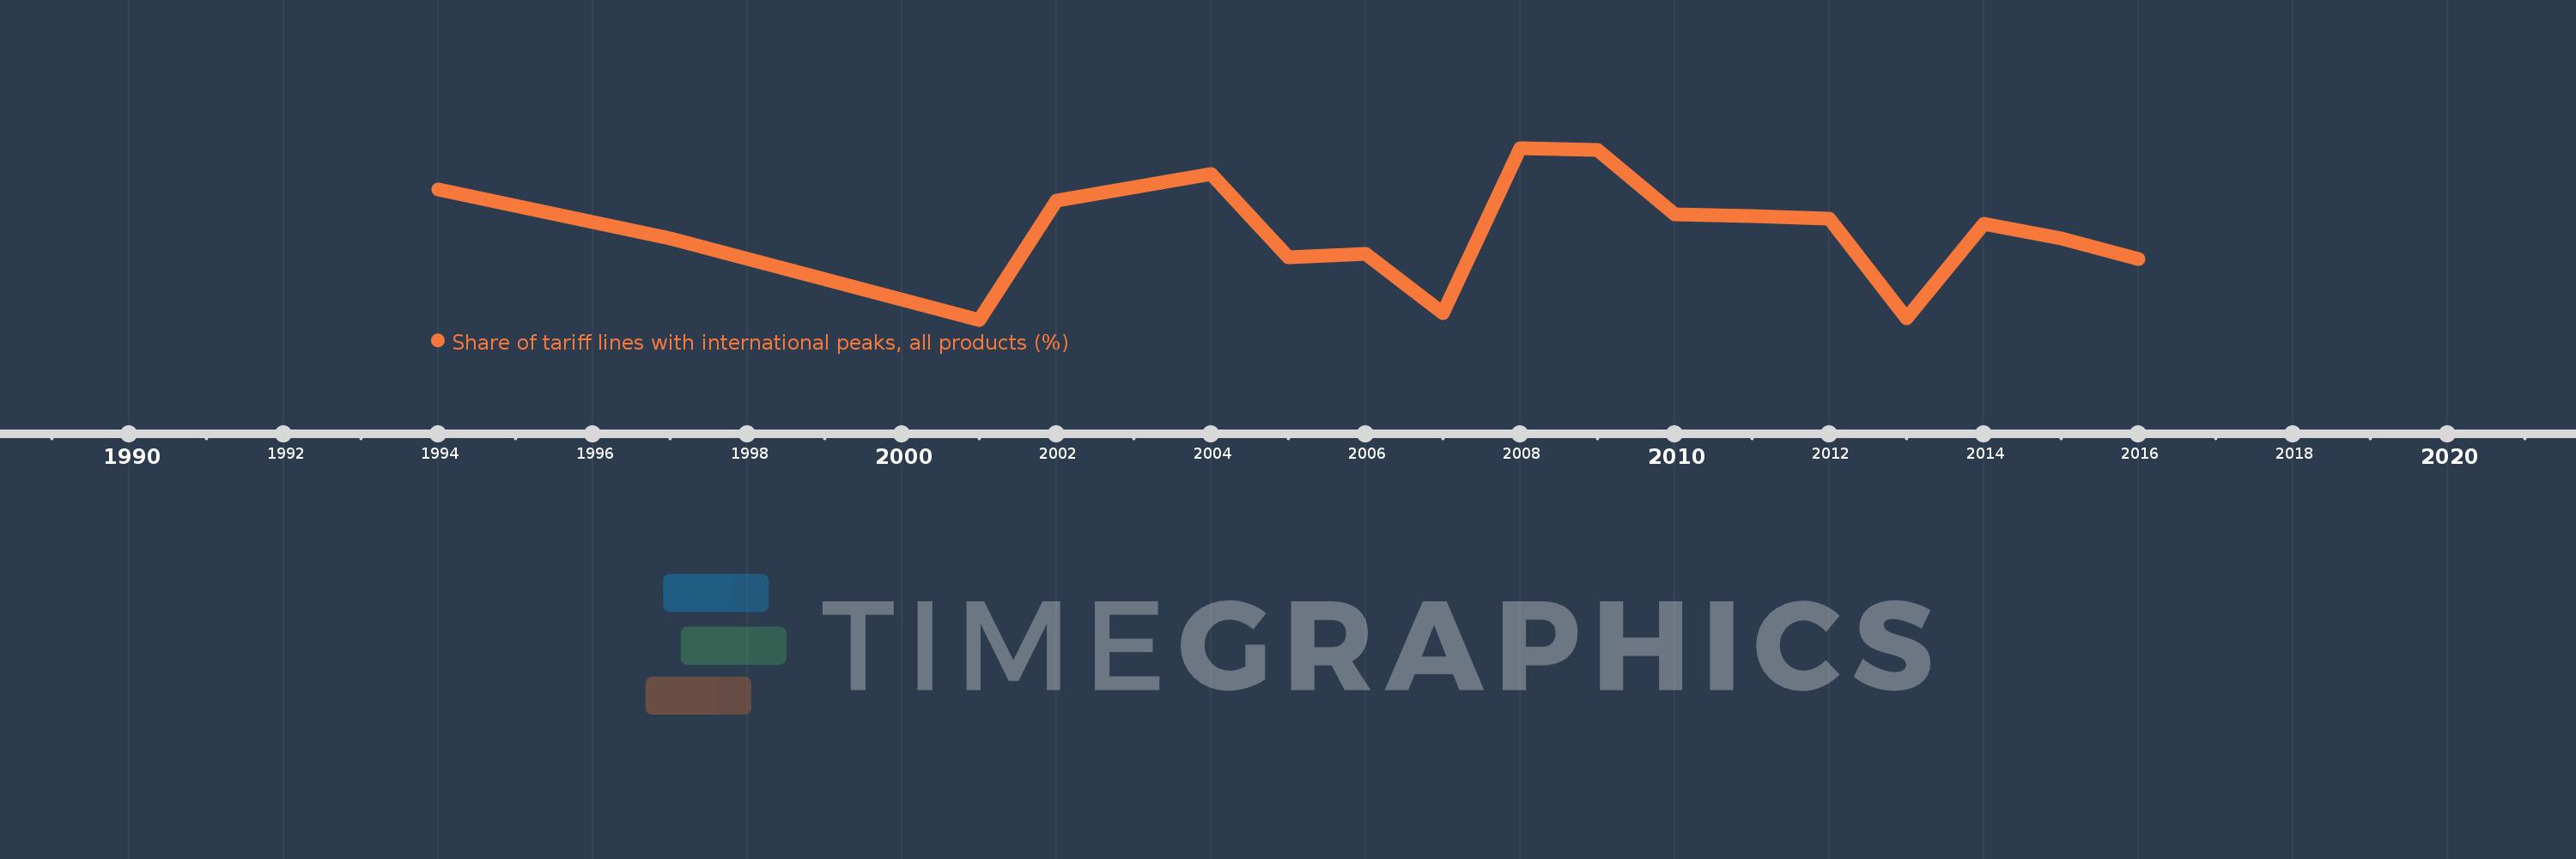
This timeline shows a graph from 1994 to 2016 of Iceland. No data until 1993. Number of actual observations by date: 17.
Source name:
World Development Indicators
Source organization:
World Bank staff estimates using the World Integrated Trade Solution system, based on data from United Nations Conference on Trade and Development's Trade Analysis and Information System (TRAINS) database.
Categories, topics:
Private Sector, Trade
Last updated:
apr 23, 2017
Indicators value changes by year
Meaning:
4.377
Minimum:
1.834
jan 1, 2001
Maximum:
6.774
jan 1, 2008
At the date of observation
Value
Absolute change
Change from the previous value
jan 1, 1994
5.574
+5.574
0.0%
jan 1, 1997
4.179
-1.396
-25.04%
jan 1, 2001
1.834
-2.345
-56.11%
jan 1, 2002
5.269
+3.435
187.31%
jan 1, 2004
6.018
+0.75
14.23%
jan 1, 2005
3.625
-2.393
-39.77%
jan 1, 2006
3.718
+0.093
2.57%
jan 1, 2007
2.03
-1.688
-45.39%
jan 1, 2008
6.774
+4.744
233.65%
jan 1, 2009
6.708
-0.066
-0.98%
jan 1, 2010
4.876
-1.832
-27.31%
jan 1, 2011
4.825
-0.051
-1.05%
jan 1, 2012
4.734
-0.09
-1.87%
jan 1, 2013
1.881
-2.853
-60.26%
jan 1, 2014
4.596
+2.715
144.3%
jan 1, 2015
4.174
-0.423
-9.2%
jan 1, 2016
3.591
-0.583
-13.96%
Ranking of countries by current statistics by years