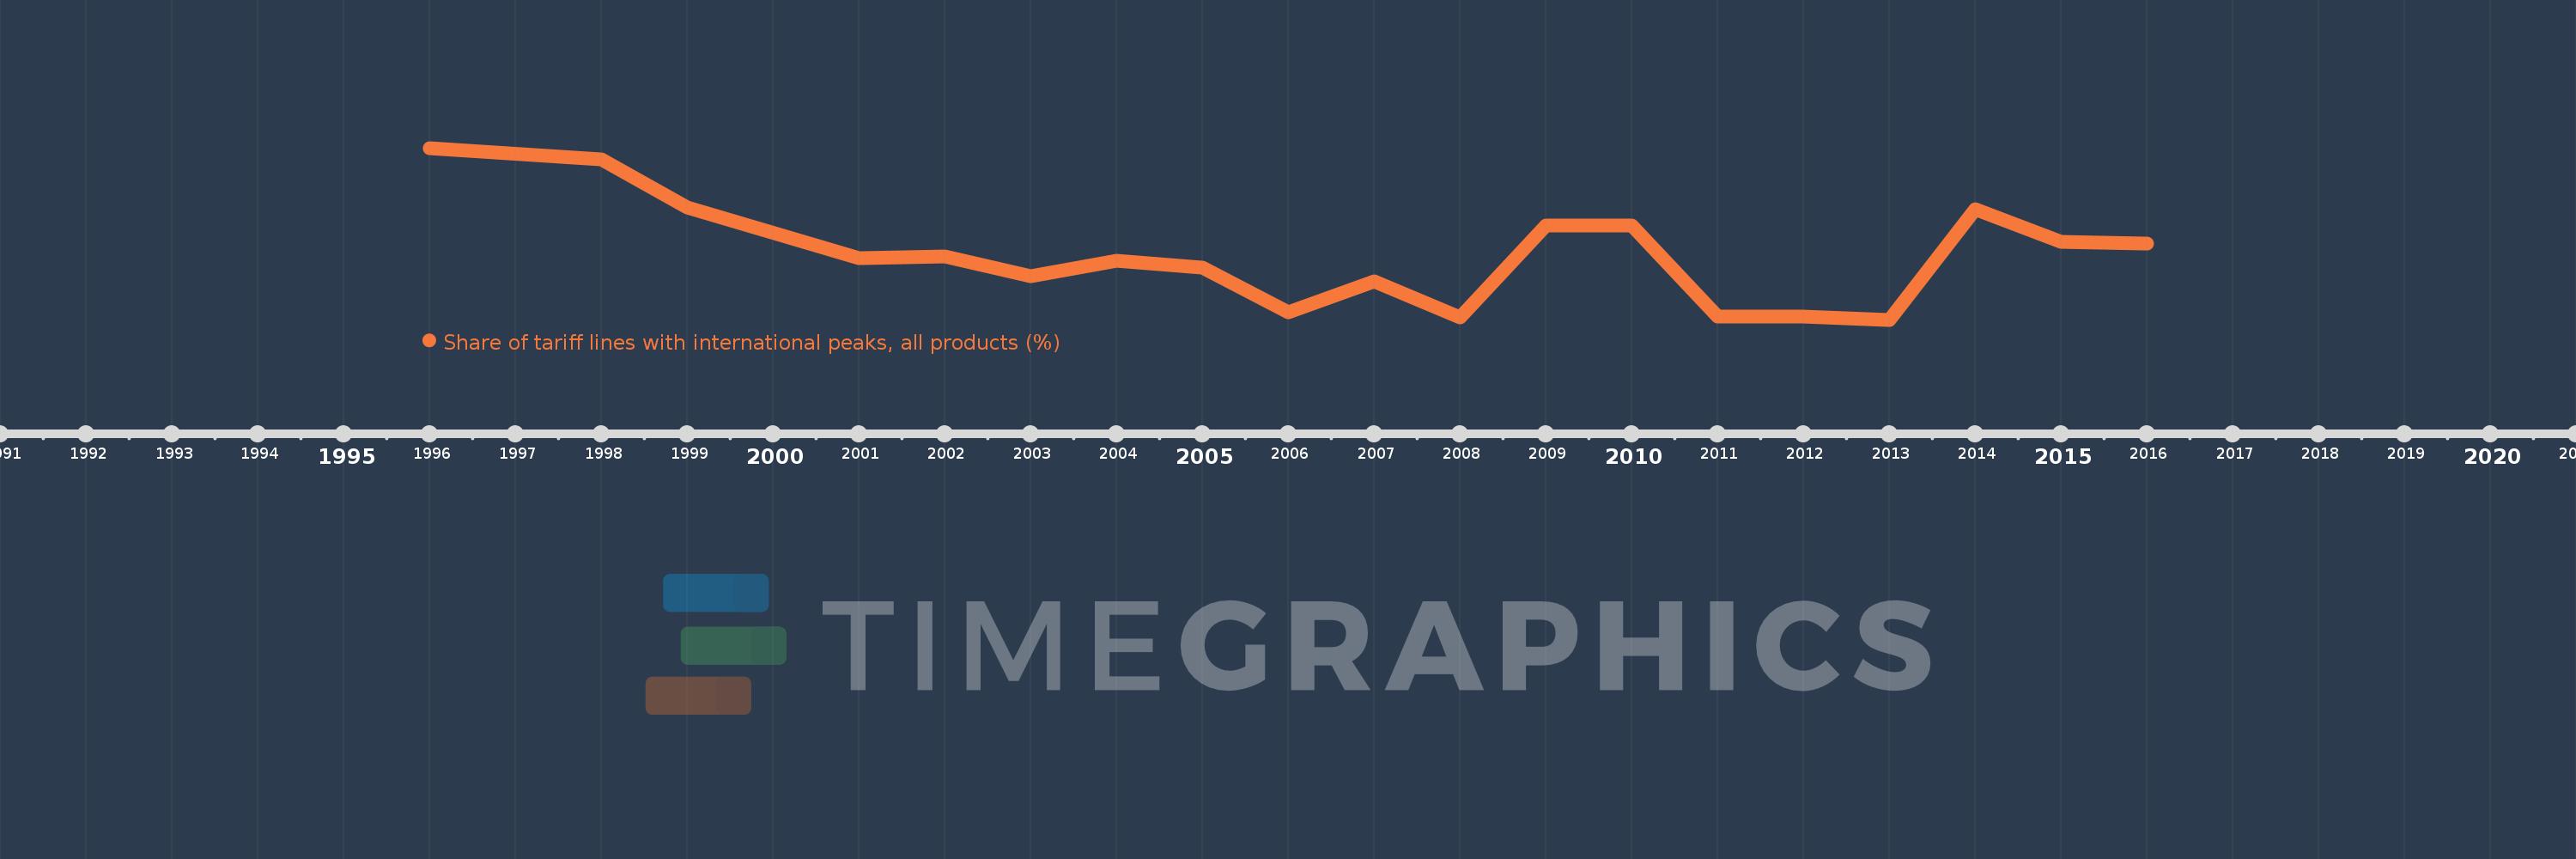
This timeline shows a graph from 1996 to 2016 of El Salvador. No data until 1995. Number of actual observations by date: 19.
Source name:
World Development Indicators
Source organization:
World Bank staff estimates using the World Integrated Trade Solution system, based on data from United Nations Conference on Trade and Development's Trade Analysis and Information System (TRAINS) database.
Categories, topics:
Private Sector, Trade
Last updated:
apr 23, 2017
Indicators value changes by year
Meaning:
10.782
Minimum:
1.229
jan 1, 2013
Maximum:
26.549
jan 1, 1996
At the date of observation
Value
Absolute change
Change from the previous value
jan 1, 1996
26.549
+26.549
0.0%
jan 1, 1998
24.818
-1.731
-6.52%
jan 1, 1999
17.714
-7.104
-28.63%
jan 1, 2001
10.348
-7.366
-41.58%
jan 1, 2002
10.609
+0.261
2.52%
jan 1, 2003
7.59
-3.019
-28.46%
jan 1, 2004
9.891
+2.301
30.32%
jan 1, 2005
8.891
-1.0
-10.11%
jan 1, 2006
2.28
-6.611
-74.35%
jan 1, 2007
6.93
+4.65
203.92%
jan 1, 2008
1.569
-5.361
-77.36%
jan 1, 2009
15.15
+13.581
865.74%
jan 1, 2010
15.069
-0.081
-0.54%
jan 1, 2011
1.755
-13.314
-88.35%
jan 1, 2012
1.731
-0.024
-1.37%
jan 1, 2013
1.229
-0.502
-29.0%
jan 1, 2014
17.549
+16.32
1.33K%
jan 1, 2015
12.767
-4.782
-27.25%
jan 1, 2016
12.417
-0.35
-2.74%
Ranking of countries by current statistics by years