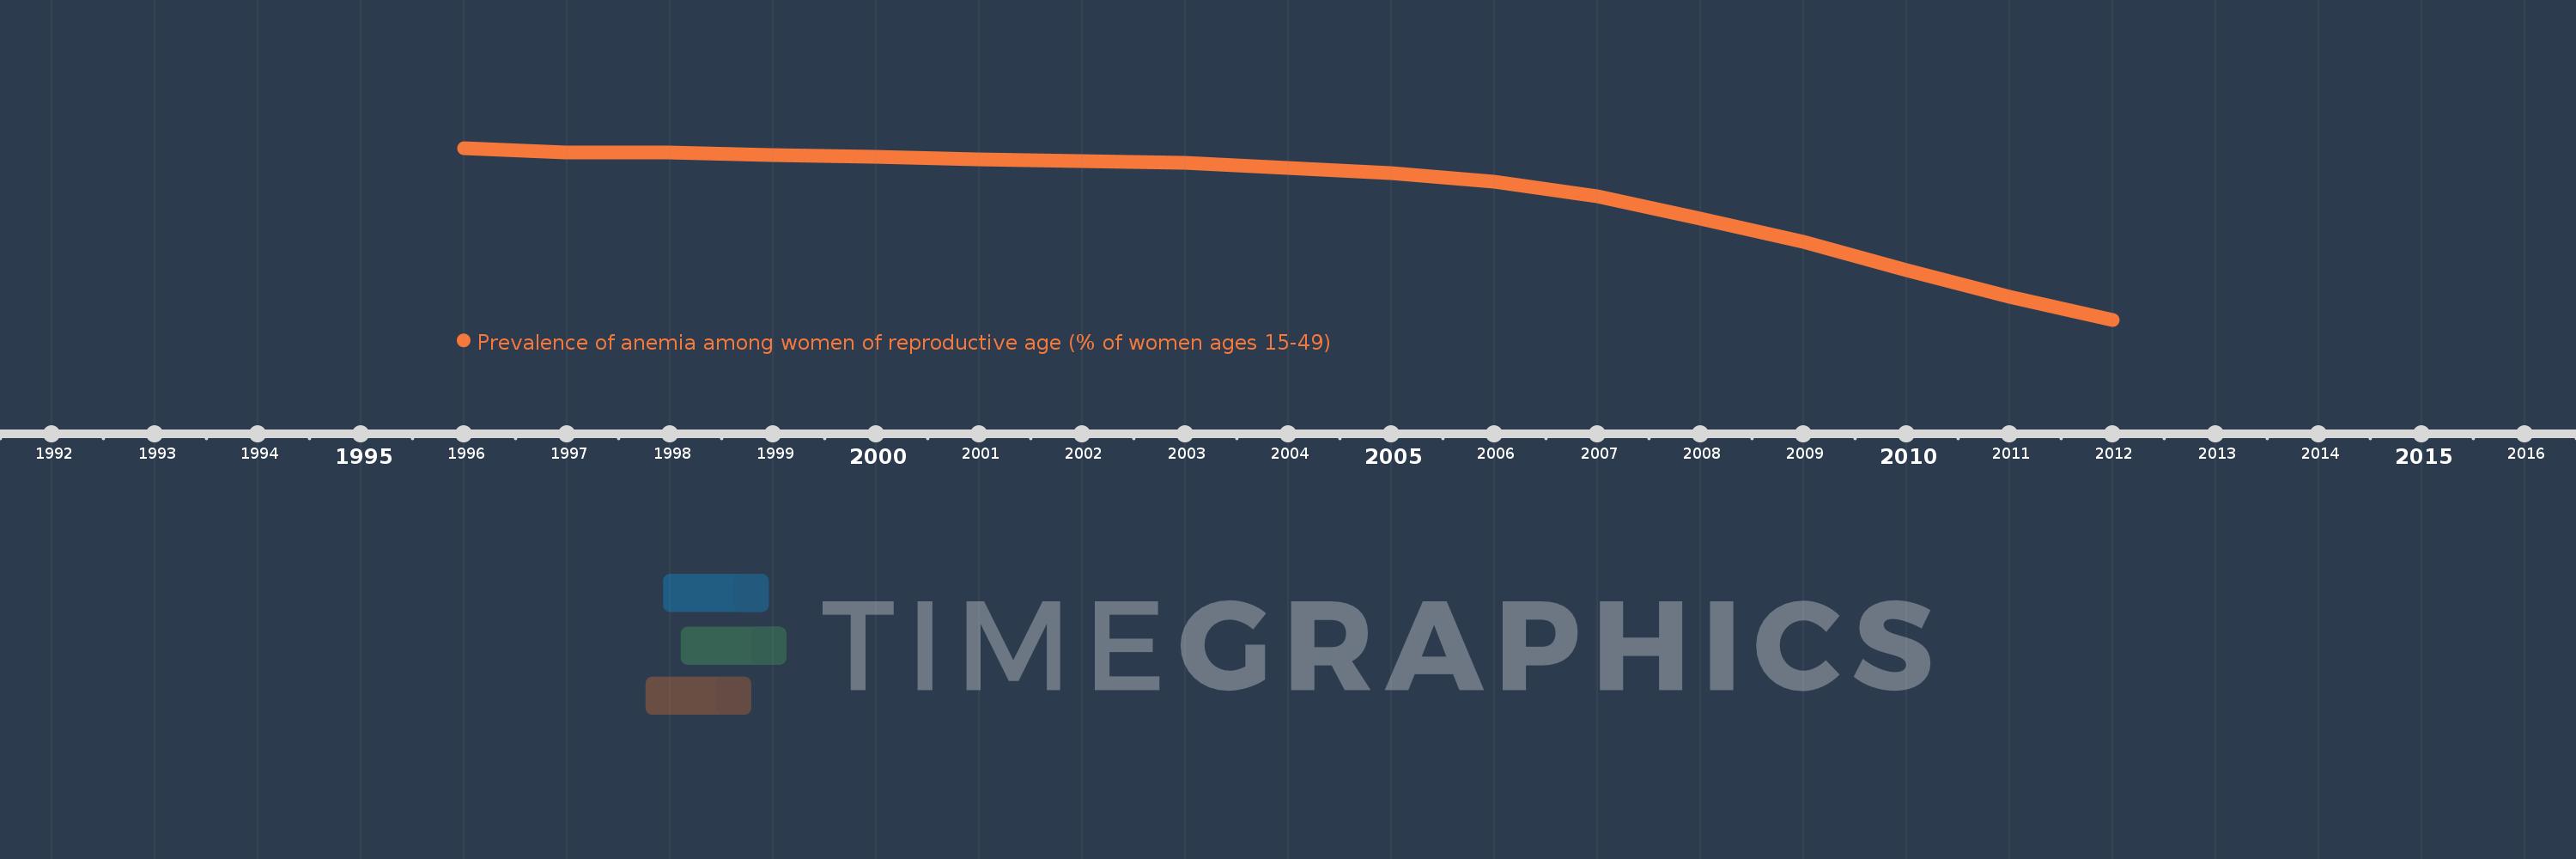
This timeline shows a graph from 1996 to 2012 of South Asia. No data until 1995. Number of actual observations by date: 17.
Source name:
World Development Indicators
Source organization:
Stevens GA et al. Global, regional, and national trends in hemoglobin concentration and prevalence of total and severe anemia in children and pregnant and non-pregnant women for 1995-2011: a systematic analysis of population-representative data. The Lancet Global Health 2013;1:e16-e25.
Categories, topics:
Health
Last updated:
apr 23, 2017
Indicators value changes by year
Meaning:
51.384
Minimum:
47.237
jan 1, 2012
Maximum:
52.942
jan 1, 1996
At the date of observation
Value
Absolute change
Change from the previous value
jan 1, 1996
52.942
+52.942
0.0%
jan 1, 1997
52.789
-0.153
-0.29%
jan 1, 1998
52.789
+0.001
0.0%
jan 1, 1999
52.719
-0.07
-0.13%
jan 1, 2000
52.644
-0.075
-0.14%
jan 1, 2001
52.574
-0.071
-0.13%
jan 1, 2002
52.509
-0.065
-0.12%
jan 1, 2003
52.452
-0.057
-0.11%
jan 1, 2004
52.277
-0.175
-0.33%
jan 1, 2005
52.109
-0.168
-0.32%
jan 1, 2006
51.825
-0.284
-0.55%
jan 1, 2007
51.326
-0.499
-0.96%
jan 1, 2008
50.607
-0.719
-1.4%
jan 1, 2009
49.819
-0.788
-1.56%
jan 1, 2010
48.894
-0.925
-1.86%
jan 1, 2011
48.01
-0.884
-1.81%
jan 1, 2012
47.237
-0.773
-1.61%
Ranking of countries by current statistics by years