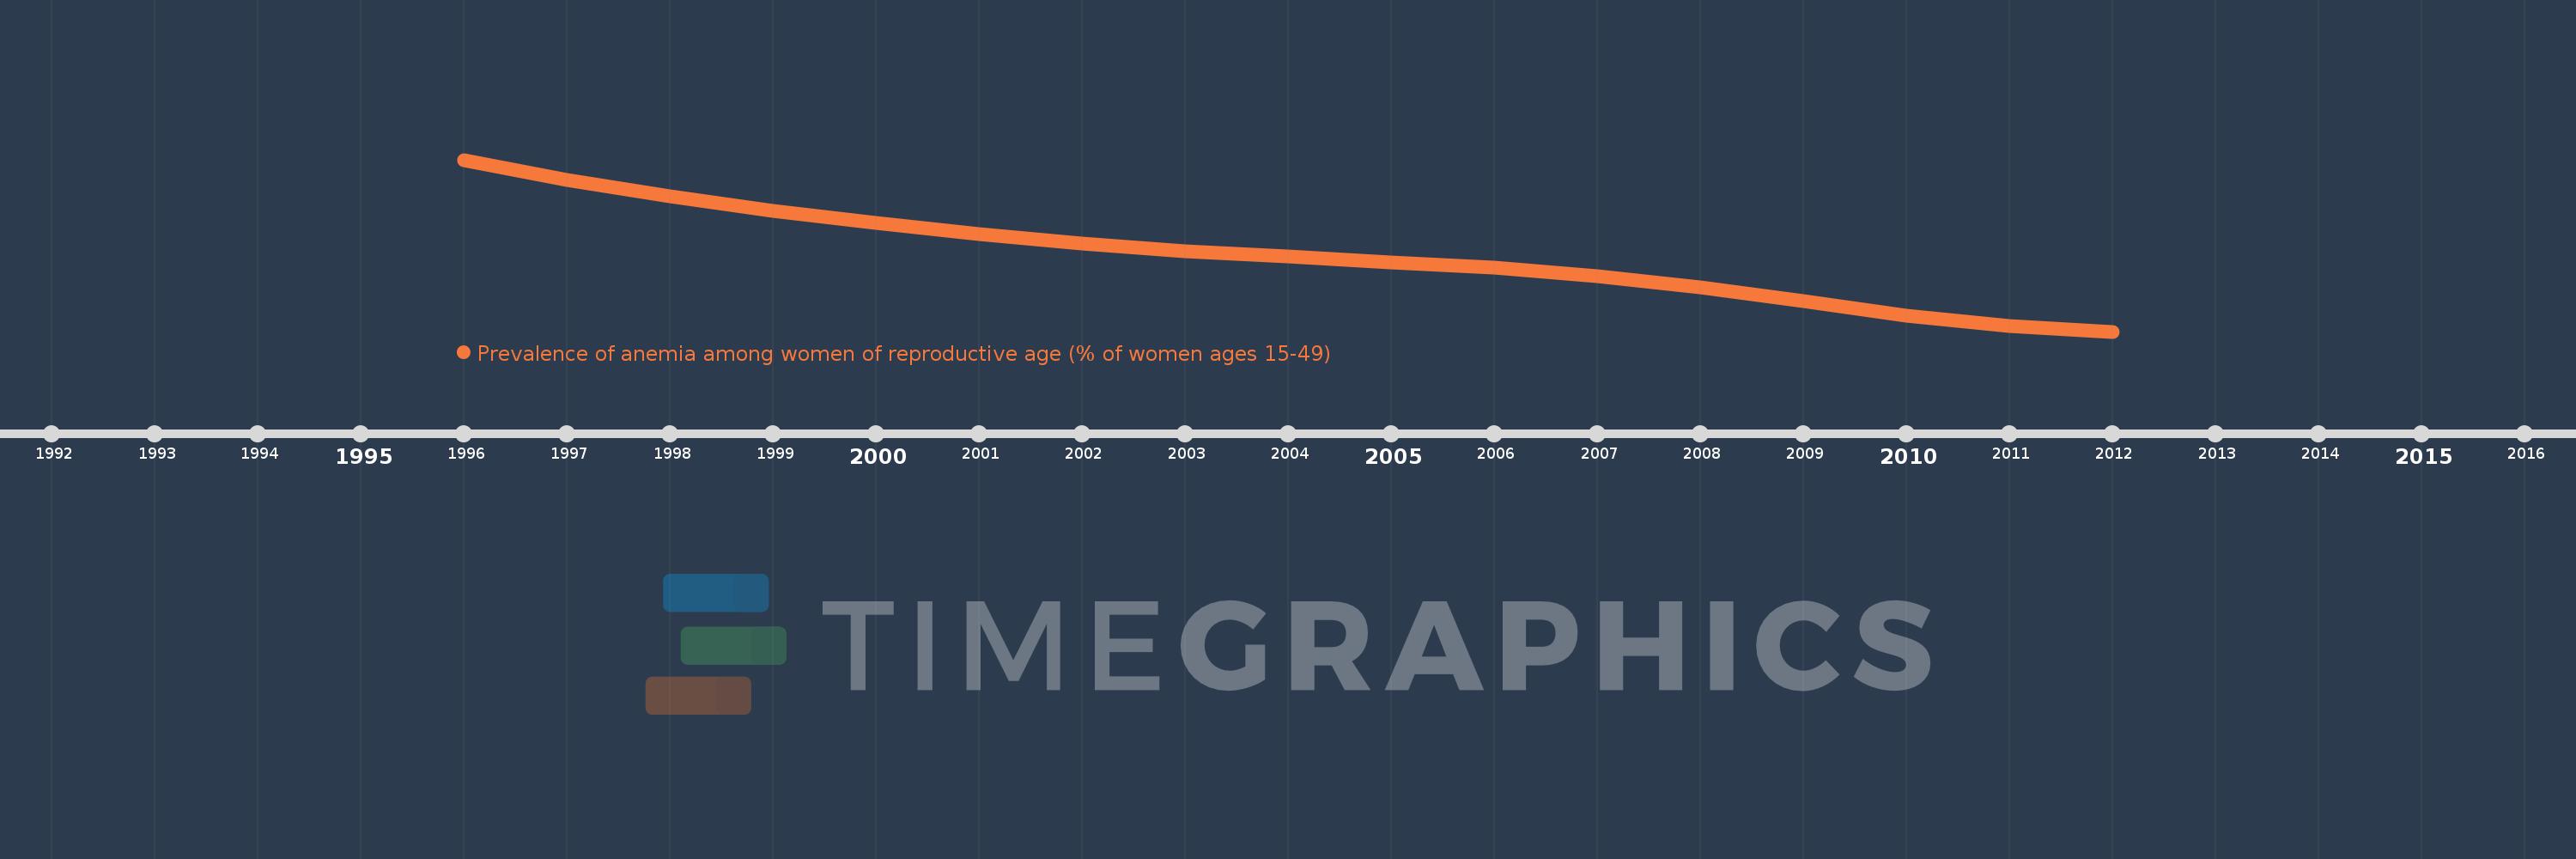
This timeline shows a graph from 1996 to 2012 of IBRD only. No data until 1995. Number of actual observations by date: 17.
Source name:
World Development Indicators
Source organization:
Stevens GA et al. Global, regional, and national trends in hemoglobin concentration and prevalence of total and severe anemia in children and pregnant and non-pregnant women for 1995-2011: a systematic analysis of population-representative data. The Lancet Global Health 2013;1:e16-e25.
Categories, topics:
Health
Last updated:
apr 23, 2017
Indicators value changes by year
Meaning:
31.572
Minimum:
29.032
jan 1, 2012
Maximum:
34.676
jan 1, 1996
At the date of observation
Value
Absolute change
Change from the previous value
jan 1, 1996
34.676
+34.676
0.0%
jan 1, 1997
34.005
-0.671
-1.93%
jan 1, 1998
33.468
-0.537
-1.58%
jan 1, 1999
32.999
-0.469
-1.4%
jan 1, 2000
32.604
-0.395
-1.2%
jan 1, 2001
32.242
-0.362
-1.11%
jan 1, 2002
31.912
-0.33
-1.02%
jan 1, 2003
31.68
-0.232
-0.73%
jan 1, 2004
31.497
-0.183
-0.58%
jan 1, 2005
31.308
-0.189
-0.6%
jan 1, 2006
31.14
-0.169
-0.54%
jan 1, 2007
30.857
-0.283
-0.91%
jan 1, 2008
30.477
-0.38
-1.23%
jan 1, 2009
30.043
-0.434
-1.42%
jan 1, 2010
29.561
-0.483
-1.61%
jan 1, 2011
29.227
-0.334
-1.13%
jan 1, 2012
29.032
-0.195
-0.67%
Ranking of countries by current statistics by years