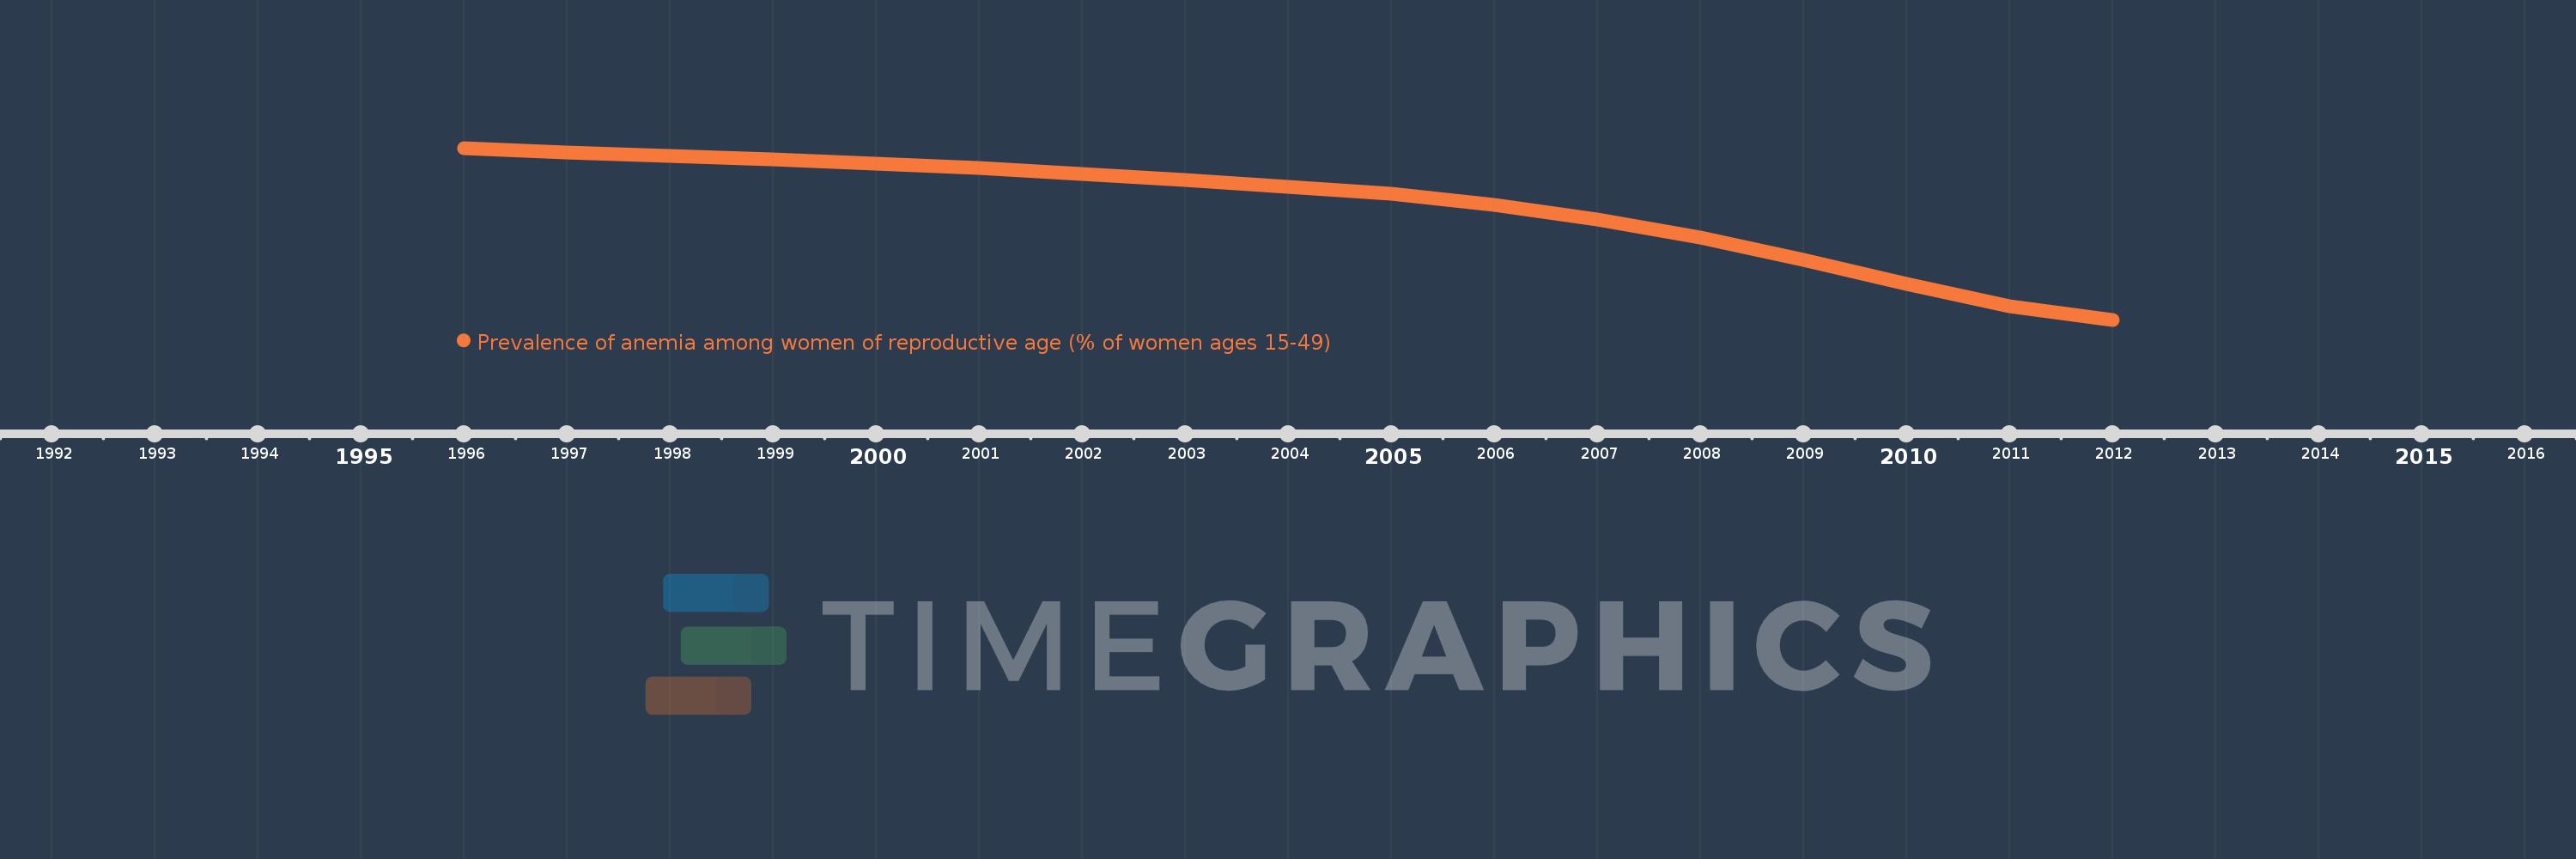
This timeline shows a graph from 1996 to 2012 of Small states. No data until 1995. Number of actual observations by date: 17.
Source name:
World Development Indicators
Source organization:
Stevens GA et al. Global, regional, and national trends in hemoglobin concentration and prevalence of total and severe anemia in children and pregnant and non-pregnant women for 1995-2011: a systematic analysis of population-representative data. The Lancet Global Health 2013;1:e16-e25.
Categories, topics:
Health
Last updated:
apr 23, 2017
Indicators value changes by year
Meaning:
34.288
Minimum:
30.542
jan 1, 2012
Maximum:
36.239
jan 1, 1996
At the date of observation
Value
Absolute change
Change from the previous value
jan 1, 1996
36.239
+36.239
0.0%
jan 1, 1997
36.081
-0.159
-0.44%
jan 1, 1998
35.96
-0.121
-0.33%
jan 1, 1999
35.853
-0.107
-0.3%
jan 1, 2000
35.708
-0.145
-0.4%
jan 1, 2001
35.565
-0.143
-0.4%
jan 1, 2002
35.372
-0.193
-0.54%
jan 1, 2003
35.183
-0.19
-0.54%
jan 1, 2004
34.96
-0.223
-0.63%
jan 1, 2005
34.713
-0.247
-0.71%
jan 1, 2006
34.353
-0.36
-1.04%
jan 1, 2007
33.866
-0.487
-1.42%
jan 1, 2008
33.278
-0.588
-1.74%
jan 1, 2009
32.525
-0.753
-2.26%
jan 1, 2010
31.716
-0.81
-2.49%
jan 1, 2011
30.988
-0.727
-2.29%
jan 1, 2012
30.542
-0.446
-1.44%
Ranking of countries by current statistics by years