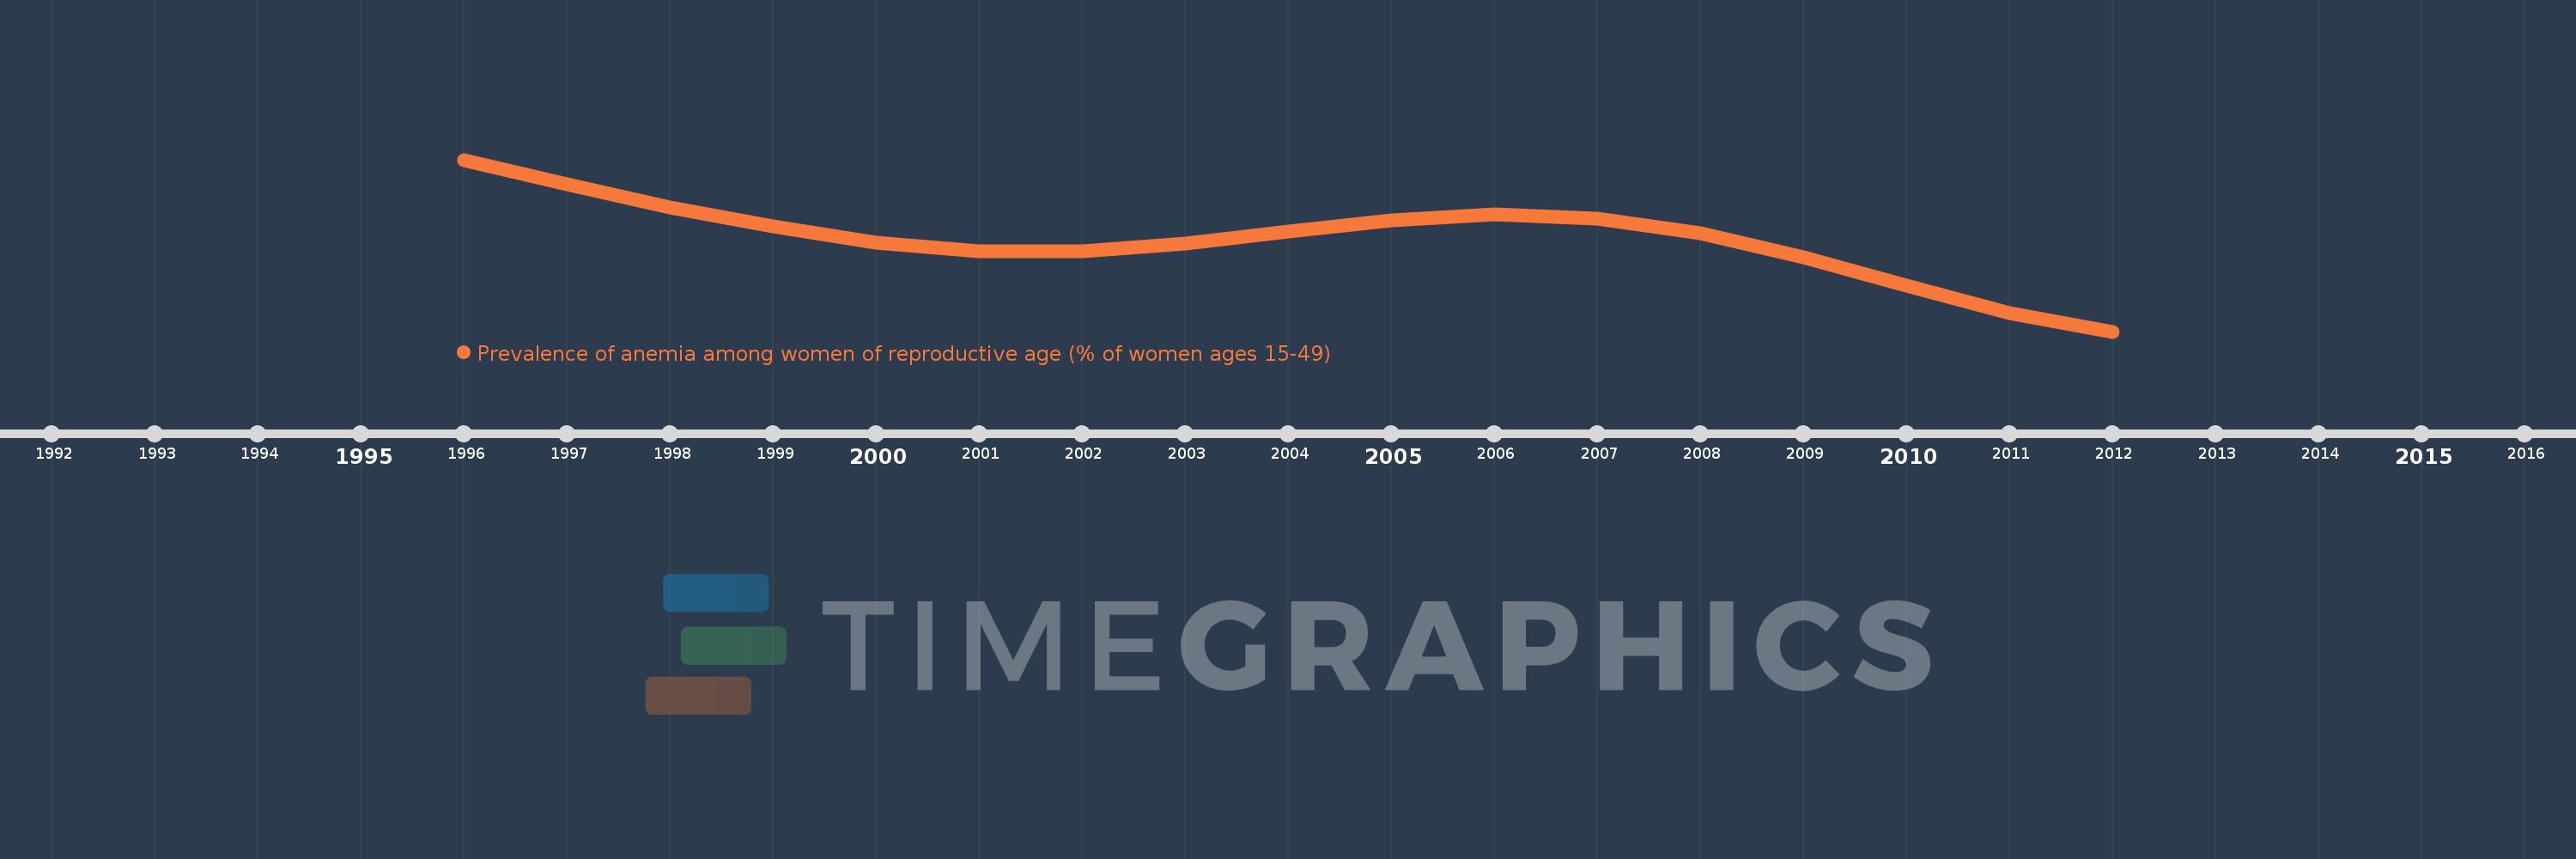
This timeline shows a graph from 1996 to 2012 of Arab World. No data until 1995. Number of actual observations by date: 17.
Source name:
World Development Indicators
Source organization:
Stevens GA et al. Global, regional, and national trends in hemoglobin concentration and prevalence of total and severe anemia in children and pregnant and non-pregnant women for 1995-2011: a systematic analysis of population-representative data. The Lancet Global Health 2013;1:e16-e25.
Categories, topics:
Health
Last updated:
apr 23, 2017
Indicators value changes by year
Meaning:
36.295
Minimum:
33.344
jan 1, 2012
Maximum:
38.844
jan 1, 1996
At the date of observation
Value
Absolute change
Change from the previous value
jan 1, 1996
38.844
+38.844
0.0%
jan 1, 1997
38.069
-0.775
-2.0%
jan 1, 1998
37.331
-0.738
-1.94%
jan 1, 1999
36.71
-0.621
-1.66%
jan 1, 2000
36.202
-0.508
-1.38%
jan 1, 2001
35.917
-0.285
-0.79%
jan 1, 2002
35.921
+0.004
0.01%
jan 1, 2003
36.161
+0.24
0.67%
jan 1, 2004
36.56
+0.399
1.1%
jan 1, 2005
36.915
+0.355
0.97%
jan 1, 2006
37.11
+0.195
0.53%
jan 1, 2007
36.956
-0.154
-0.42%
jan 1, 2008
36.496
-0.46
-1.24%
jan 1, 2009
35.717
-0.779
-2.13%
jan 1, 2010
34.808
-0.909
-2.55%
jan 1, 2011
33.948
-0.86
-2.47%
jan 1, 2012
33.344
-0.604
-1.78%
Ranking of countries by current statistics by years