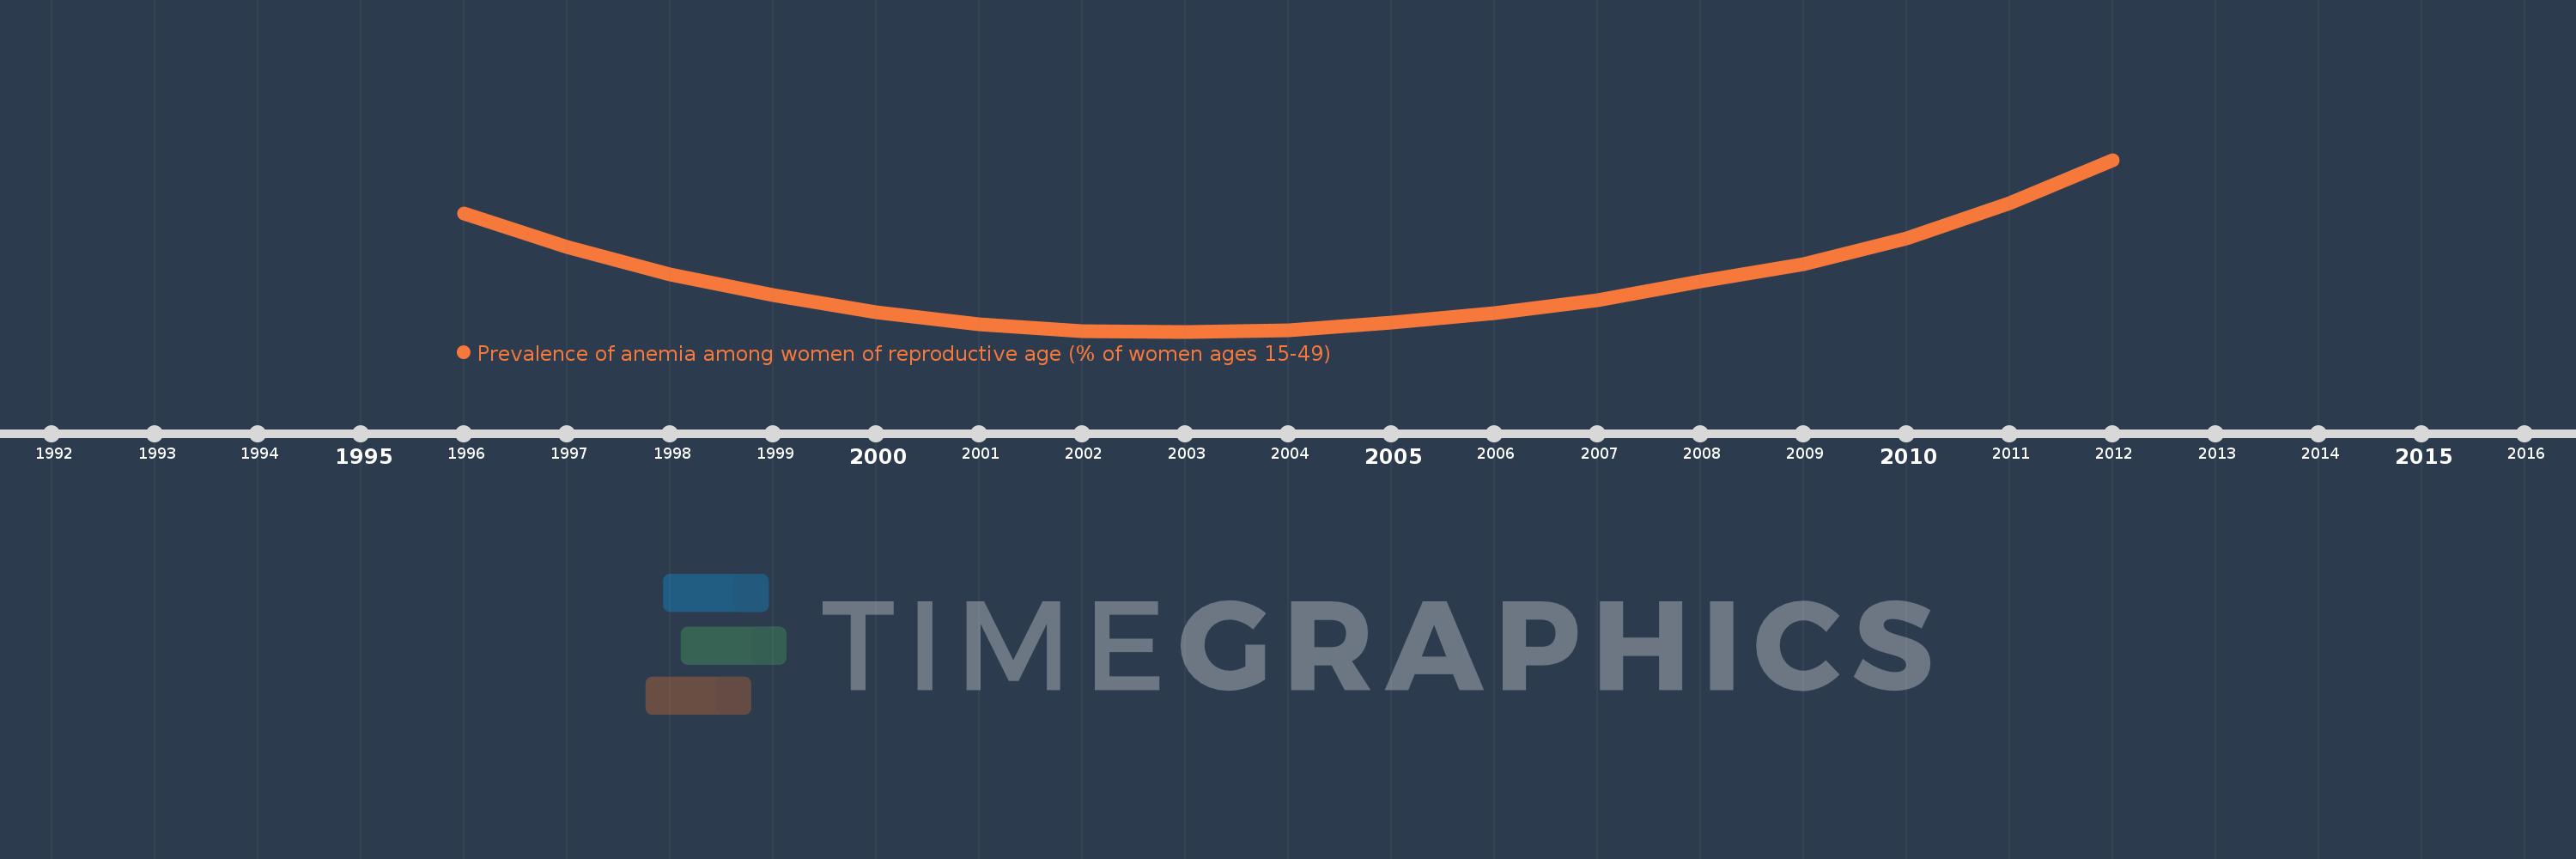
This timeline shows a graph from 1996 to 2012 of Euro area. No data until 1995. Number of actual observations by date: 17.
Source name:
World Development Indicators
Source organization:
Stevens GA et al. Global, regional, and national trends in hemoglobin concentration and prevalence of total and severe anemia in children and pregnant and non-pregnant women for 1995-2011: a systematic analysis of population-representative data. The Lancet Global Health 2013;1:e16-e25.
Categories, topics:
Health
Last updated:
apr 23, 2017
Indicators value changes by year
Meaning:
16.426
Minimum:
15.383
jan 1, 2003
Maximum:
18.784
jan 1, 2012
At the date of observation
Value
Absolute change
Change from the previous value
jan 1, 1996
17.727
+17.727
0.0%
jan 1, 1997
17.058
-0.669
-3.77%
jan 1, 1998
16.522
-0.536
-3.14%
jan 1, 1999
16.107
-0.414
-2.51%
jan 1, 2000
15.765
-0.342
-2.12%
jan 1, 2001
15.532
-0.233
-1.48%
jan 1, 2002
15.389
-0.143
-0.92%
jan 1, 2003
15.383
-0.006
-0.04%
jan 1, 2004
15.415
+0.033
0.21%
jan 1, 2005
15.562
+0.147
0.95%
jan 1, 2006
15.757
+0.195
1.25%
jan 1, 2007
16.002
+0.245
1.56%
jan 1, 2008
16.371
+0.369
2.31%
jan 1, 2009
16.717
+0.346
2.11%
jan 1, 2010
17.231
+0.513
3.07%
jan 1, 2011
17.918
+0.687
3.99%
jan 1, 2012
18.784
+0.866
4.83%
Ranking of countries by current statistics by years