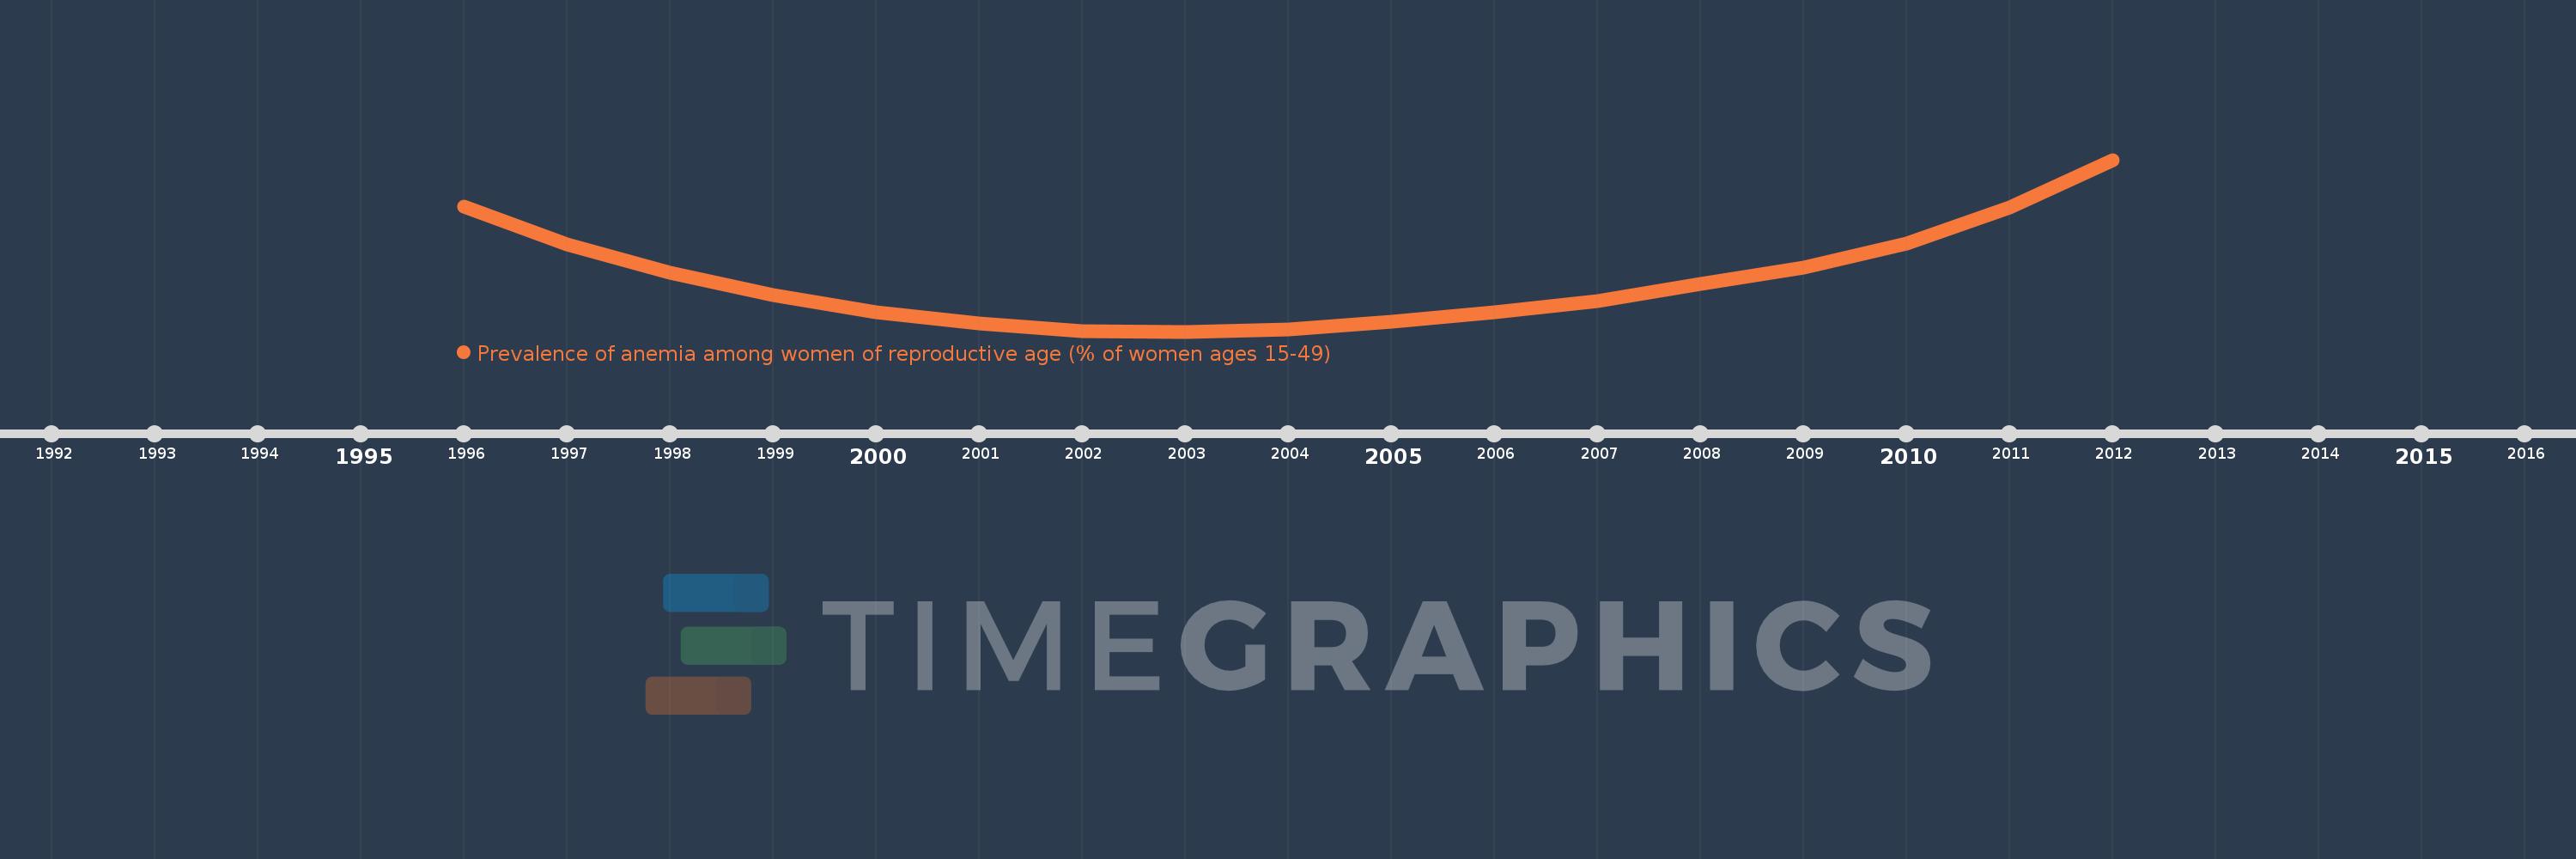
This timeline shows a graph from 1996 to 2012 of European Union. No data until 1995. Number of actual observations by date: 17.
Source name:
World Development Indicators
Source organization:
Stevens GA et al. Global, regional, and national trends in hemoglobin concentration and prevalence of total and severe anemia in children and pregnant and non-pregnant women for 1995-2011: a systematic analysis of population-representative data. The Lancet Global Health 2013;1:e16-e25.
Categories, topics:
Health
Last updated:
apr 23, 2017
Indicators value changes by year
Meaning:
17.119
Minimum:
16.243
jan 1, 2003
Maximum:
19.108
jan 1, 2012
At the date of observation
Value
Absolute change
Change from the previous value
jan 1, 1996
18.323
+18.323
0.0%
jan 1, 1997
17.704
-0.619
-3.38%
jan 1, 1998
17.22
-0.484
-2.73%
jan 1, 1999
16.854
-0.366
-2.13%
jan 1, 2000
16.571
-0.283
-1.68%
jan 1, 2001
16.372
-0.198
-1.2%
jan 1, 2002
16.247
-0.125
-0.76%
jan 1, 2003
16.243
-0.004
-0.02%
jan 1, 2004
16.274
+0.031
0.19%
jan 1, 2005
16.406
+0.132
0.81%
jan 1, 2006
16.563
+0.157
0.96%
jan 1, 2007
16.756
+0.193
1.17%
jan 1, 2008
17.039
+0.283
1.69%
jan 1, 2009
17.308
+0.269
1.58%
jan 1, 2010
17.715
+0.407
2.35%
jan 1, 2011
18.312
+0.597
3.37%
jan 1, 2012
19.108
+0.796
4.35%
Ranking of countries by current statistics by years