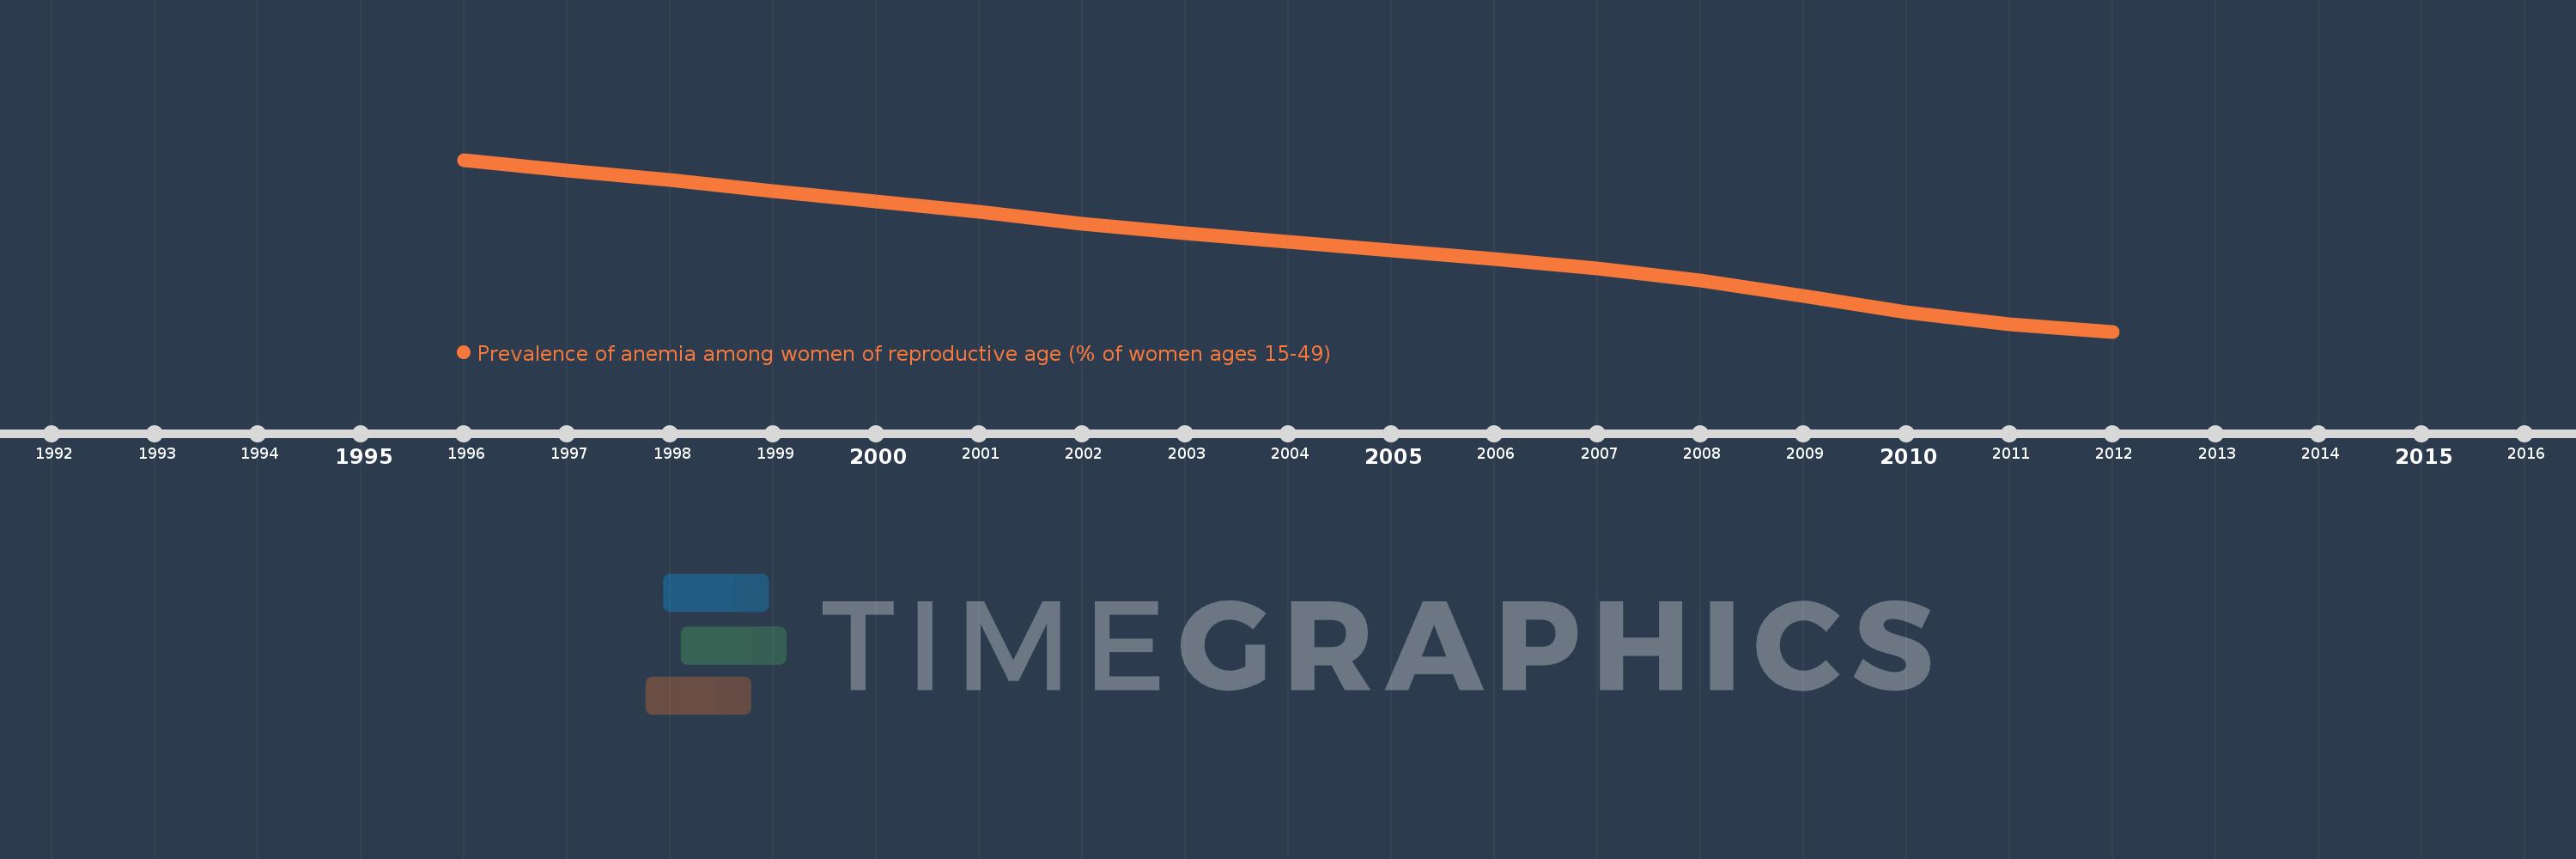
This timeline shows a graph from 1996 to 2012 of IDA blend. No data until 1995. Number of actual observations by date: 17.
Source name:
World Development Indicators
Source organization:
Stevens GA et al. Global, regional, and national trends in hemoglobin concentration and prevalence of total and severe anemia in children and pregnant and non-pregnant women for 1995-2011: a systematic analysis of population-representative data. The Lancet Global Health 2013;1:e16-e25.
Categories, topics:
Health
Last updated:
apr 23, 2017
Indicators value changes by year
Meaning:
43.372
Minimum:
40.521
jan 1, 2012
Maximum:
46.068
jan 1, 1996
At the date of observation
Value
Absolute change
Change from the previous value
jan 1, 1996
46.068
+46.068
0.0%
jan 1, 1997
45.717
-0.351
-0.76%
jan 1, 1998
45.419
-0.297
-0.65%
jan 1, 1999
45.058
-0.361
-0.8%
jan 1, 2000
44.723
-0.335
-0.74%
jan 1, 2001
44.377
-0.346
-0.77%
jan 1, 2002
43.997
-0.38
-0.86%
jan 1, 2003
43.685
-0.312
-0.71%
jan 1, 2004
43.433
-0.252
-0.58%
jan 1, 2005
43.147
-0.286
-0.66%
jan 1, 2006
42.878
-0.268
-0.62%
jan 1, 2007
42.551
-0.328
-0.76%
jan 1, 2008
42.158
-0.392
-0.92%
jan 1, 2009
41.671
-0.487
-1.16%
jan 1, 2010
41.157
-0.514
-1.23%
jan 1, 2011
40.768
-0.389
-0.95%
jan 1, 2012
40.521
-0.247
-0.61%
Ranking of countries by current statistics by years