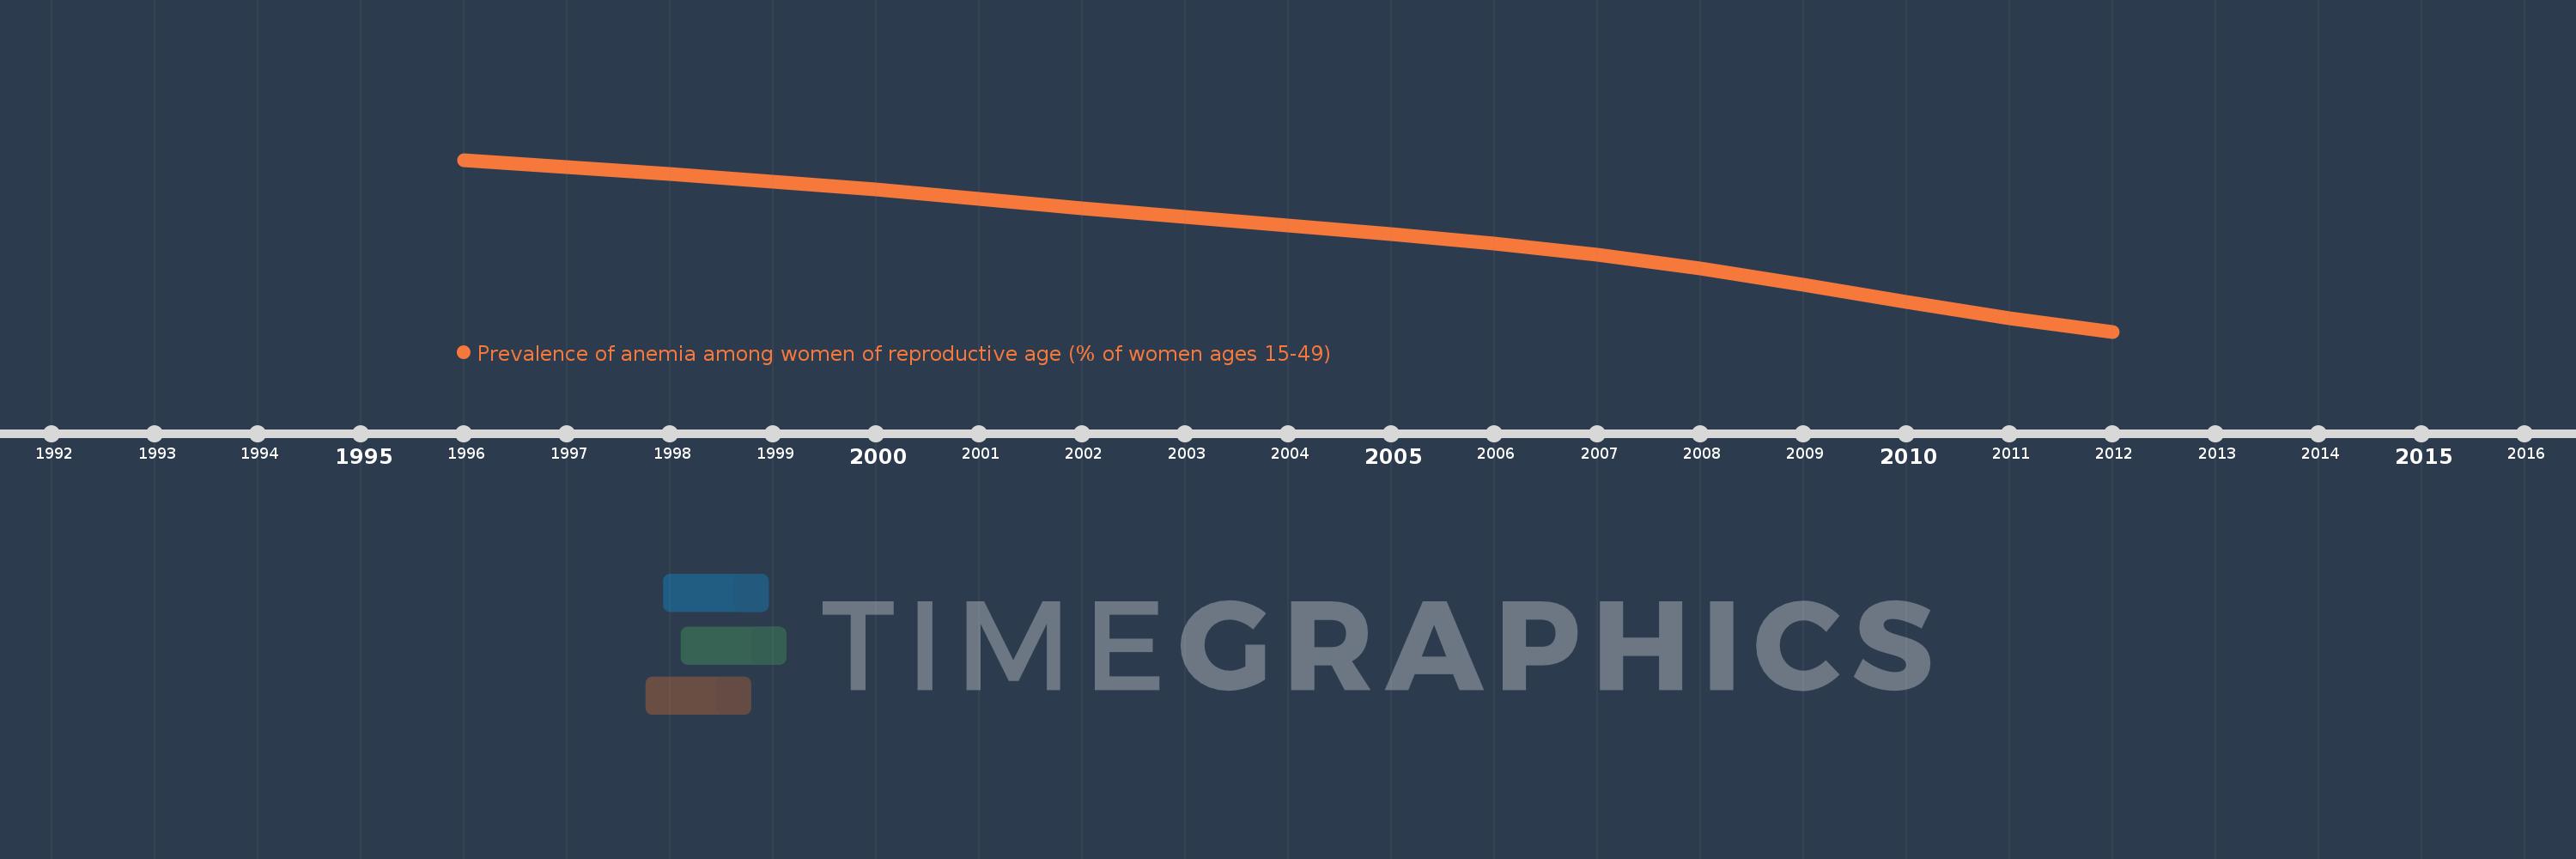
This timeline shows a graph from 1996 to 2012 of IDA total. No data until 1995. Number of actual observations by date: 17.
Source name:
World Development Indicators
Source organization:
Stevens GA et al. Global, regional, and national trends in hemoglobin concentration and prevalence of total and severe anemia in children and pregnant and non-pregnant women for 1995-2011: a systematic analysis of population-representative data. The Lancet Global Health 2013;1:e16-e25.
Categories, topics:
Health
Last updated:
apr 23, 2017
Indicators value changes by year
Meaning:
43.005
Minimum:
38.361
jan 1, 2012
Maximum:
46.443
jan 1, 1996
At the date of observation
Value
Absolute change
Change from the previous value
jan 1, 1996
46.443
+46.443
0.0%
jan 1, 1997
46.118
-0.326
-0.7%
jan 1, 1998
45.793
-0.325
-0.7%
jan 1, 1999
45.421
-0.372
-0.81%
jan 1, 2000
45.03
-0.391
-0.86%
jan 1, 2001
44.618
-0.411
-0.91%
jan 1, 2002
44.171
-0.447
-1.0%
jan 1, 2003
43.753
-0.418
-0.95%
jan 1, 2004
43.363
-0.39
-0.89%
jan 1, 2005
42.942
-0.421
-0.97%
jan 1, 2006
42.491
-0.45
-1.05%
jan 1, 2007
41.962
-0.529
-1.25%
jan 1, 2008
41.324
-0.638
-1.52%
jan 1, 2009
40.572
-0.751
-1.82%
jan 1, 2010
39.743
-0.83
-2.04%
jan 1, 2011
38.973
-0.77
-1.94%
jan 1, 2012
38.361
-0.612
-1.57%
Ranking of countries by current statistics by years