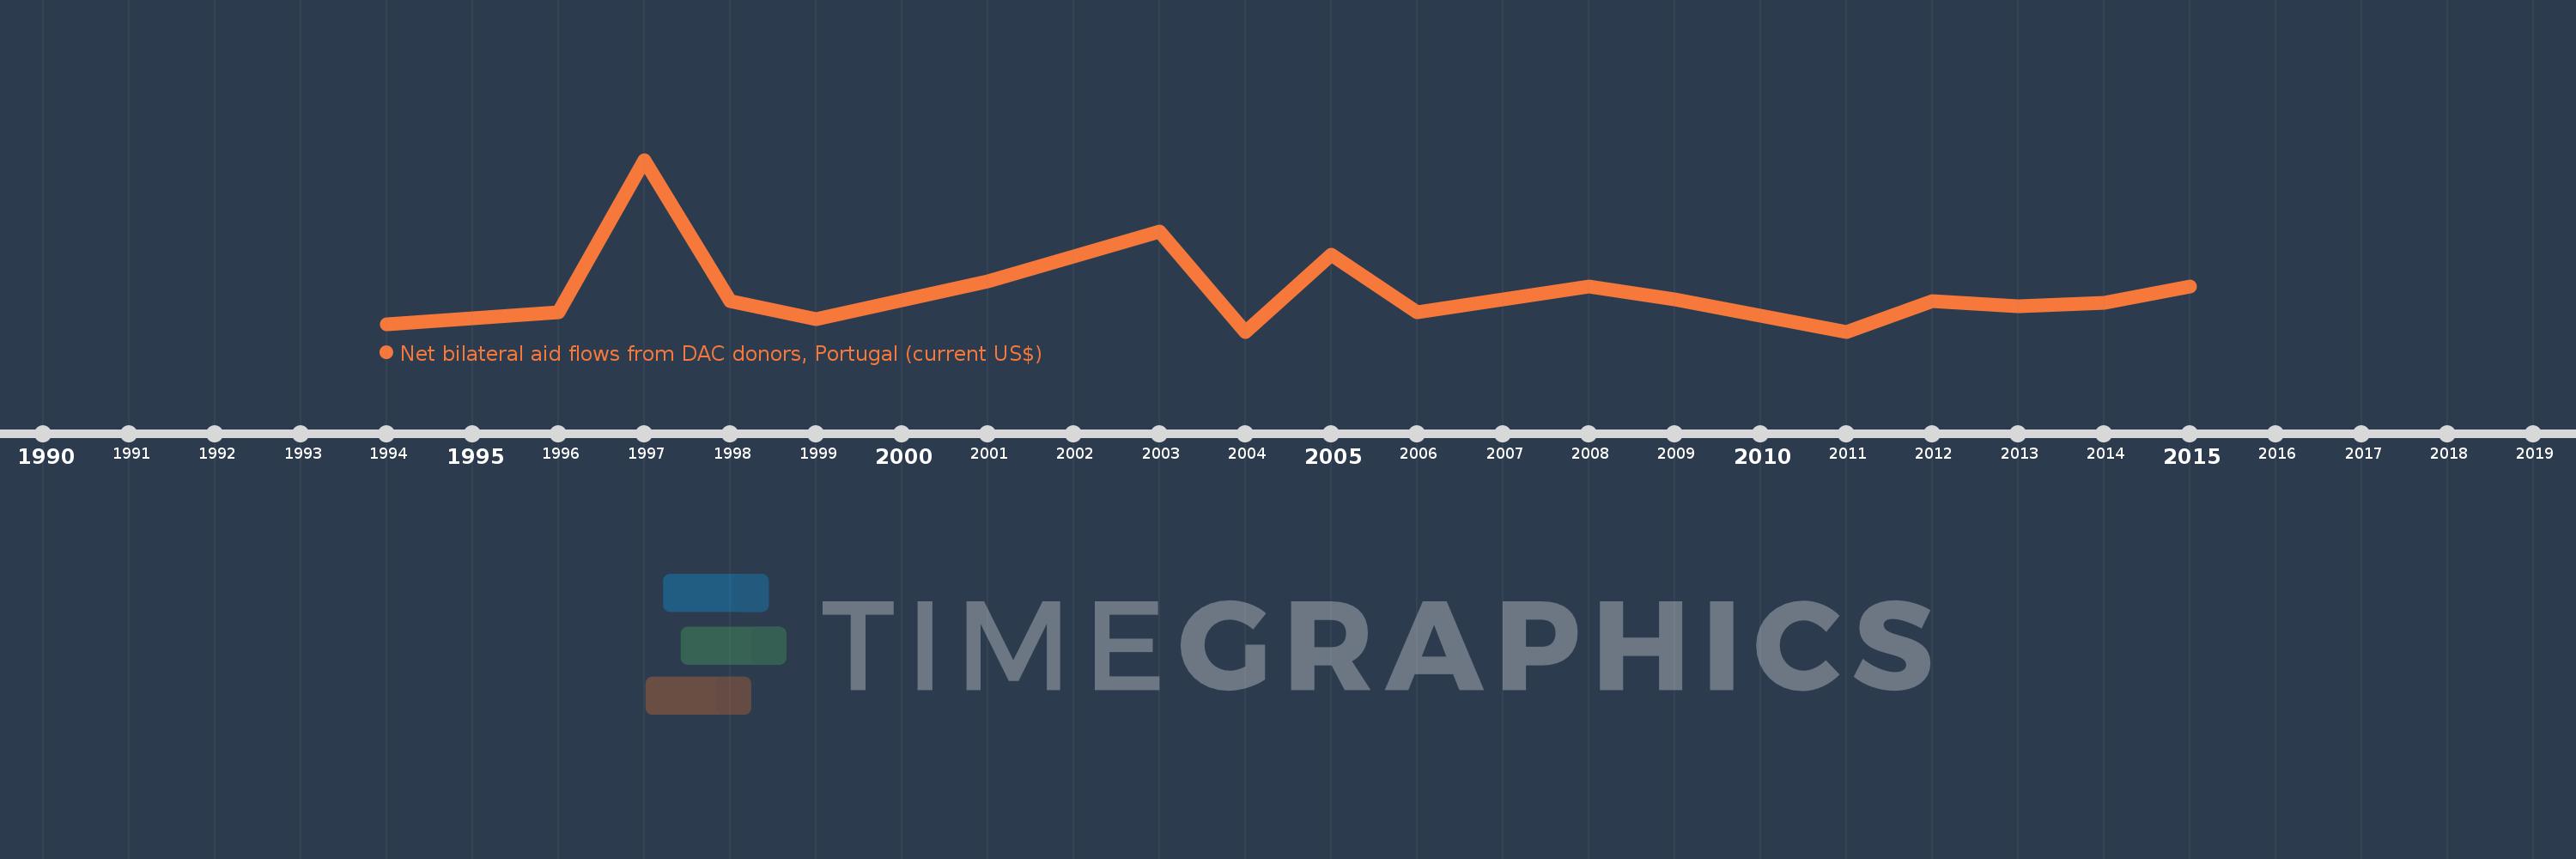
This timeline shows a graph from 1994 to 2015 of OECD members. No data until 1993. Number of actual observations by date: 20.
Source name:
World Development Indicators
Source organization:
Development Assistance Committee of the Organisation for Economic Co-operation and Development, Geographical Distribution of Financial Flows to Developing Countries, Development Co-operation Report, and International Development Statistics database. Data are available online at: www.oecd.org/dac/stats/idsonline.
Categories, topics:
Aid Effectiveness
Last updated:
apr 23, 2017
Indicators value changes by year
Meaning:
298.5K
Minimum:
70.0K
jan 1, 2004
Maximum:
1.03 mln
jan 1, 1997
At the date of observation
Value
Absolute change
Change from the previous value
jan 1, 1994
110.0K
+110.0K
0.0%
jan 1, 1996
180.0K
+70.0K
63.64%
jan 1, 1997
1.03 mln
+850.0K
472.22%
jan 1, 1998
240.0K
-790.0K
-76.7%
jan 1, 1999
140.0K
-100.0K
-41.67%
jan 1, 2001
350.0K
+210.0K
150.0%
jan 1, 2002
490.0K
+140.0K
40.0%
jan 1, 2003
630.0K
+140.0K
28.57%
jan 1, 2004
70.0K
-560.0K
-88.89%
jan 1, 2005
500.0K
+430.0K
614.29%
jan 1, 2006
180.0K
-320.0K
-64.0%
jan 1, 2007
250.0K
+70.0K
38.89%
jan 1, 2008
320.0K
+70.0K
28.0%
jan 1, 2009
250.0K
-70.0K
-21.88%
jan 1, 2010
160.0K
-90.0K
-36.0%
jan 1, 2011
70.0K
-90.0K
-56.25%
jan 1, 2012
240.0K
+170.0K
242.86%
jan 1, 2013
210.0K
-30.0K
-12.5%
jan 1, 2014
230.0K
+20.0K
9.52%
jan 1, 2015
320.0K
+90.0K
39.13%
Ranking of countries by current statistics by years