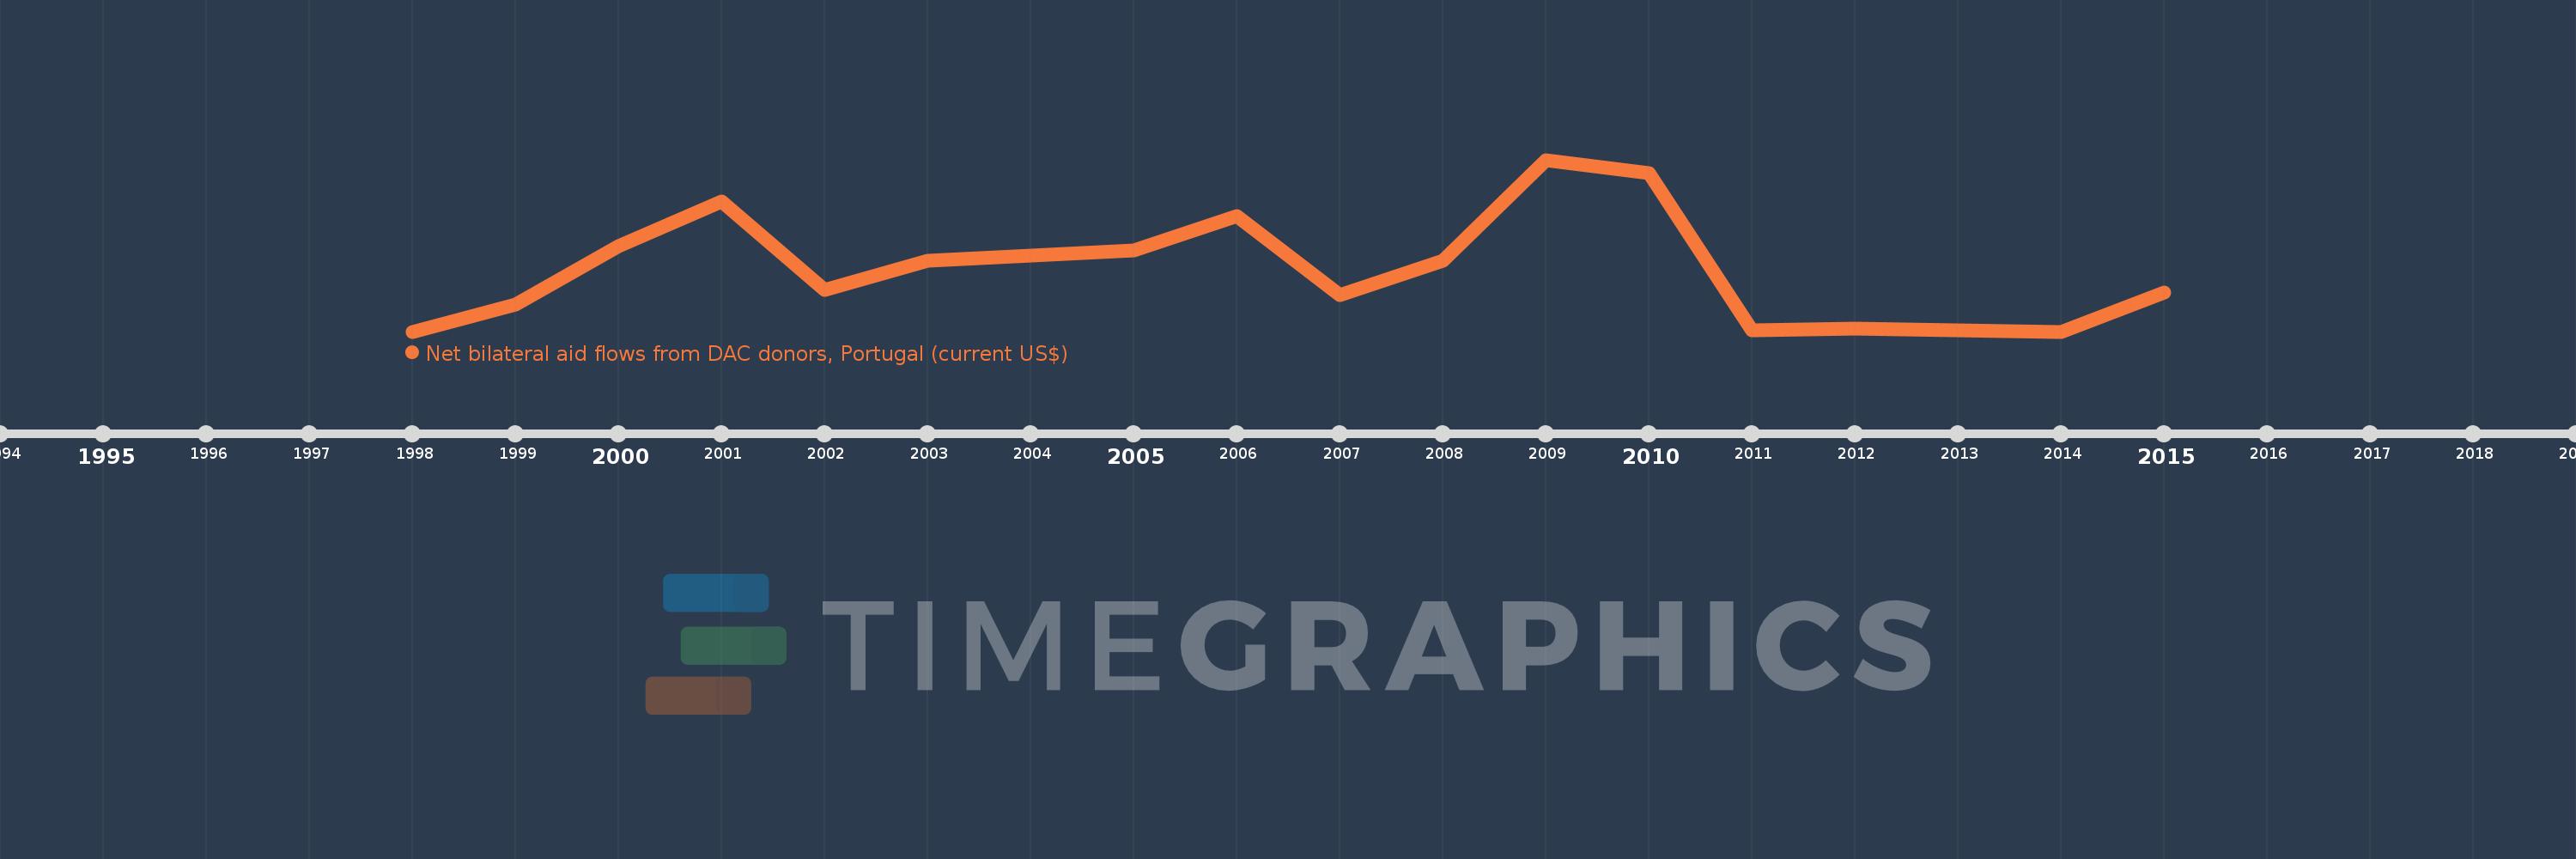
This timeline shows a graph from 1998 to 2015 of West Bank and Gaza. No data until 1997. Number of actual observations by date: 17.
Source name:
World Development Indicators
Source organization:
Development Assistance Committee of the Organisation for Economic Co-operation and Development, Geographical Distribution of Financial Flows to Developing Countries, Development Co-operation Report, and International Development Statistics database. Data are available online at: www.oecd.org/dac/stats/idsonline.
Categories, topics:
Aid Effectiveness
Last updated:
apr 23, 2017
Indicators value changes by year
Meaning:
421.176K
Minimum:
0.0
jan 1, 1998
Maximum:
1.19 mln
jan 1, 2009
At the date of observation
Value
Absolute change
Change from the previous value
jan 1, 1998
0.0
0.0
0.0%
jan 1, 1999
190.0K
+190.0K
%
jan 1, 2000
590.0K
+400.0K
210.53%
jan 1, 2001
900.0K
+310.0K
52.54%
jan 1, 2002
290.0K
-610.0K
-67.78%
jan 1, 2003
490.0K
+200.0K
68.97%
jan 1, 2005
560.0K
+70.0K
14.29%
jan 1, 2006
800.0K
+240.0K
42.86%
jan 1, 2007
250.0K
-550.0K
-68.75%
jan 1, 2008
490.0K
+240.0K
96.0%
jan 1, 2009
1.19 mln
+700.0K
142.86%
jan 1, 2010
1.1 mln
-90.0K
-7.56%
jan 1, 2011
10.0K
-1.09 mln
-99.09%
jan 1, 2012
20.0K
+10.0K
100.0%
jan 1, 2013
10.0K
-10.0K
-50.0%
jan 1, 2014
0.0
-10.0K
-100.0%
jan 1, 2015
270.0K
+270.0K
%
Ranking of countries by current statistics by years