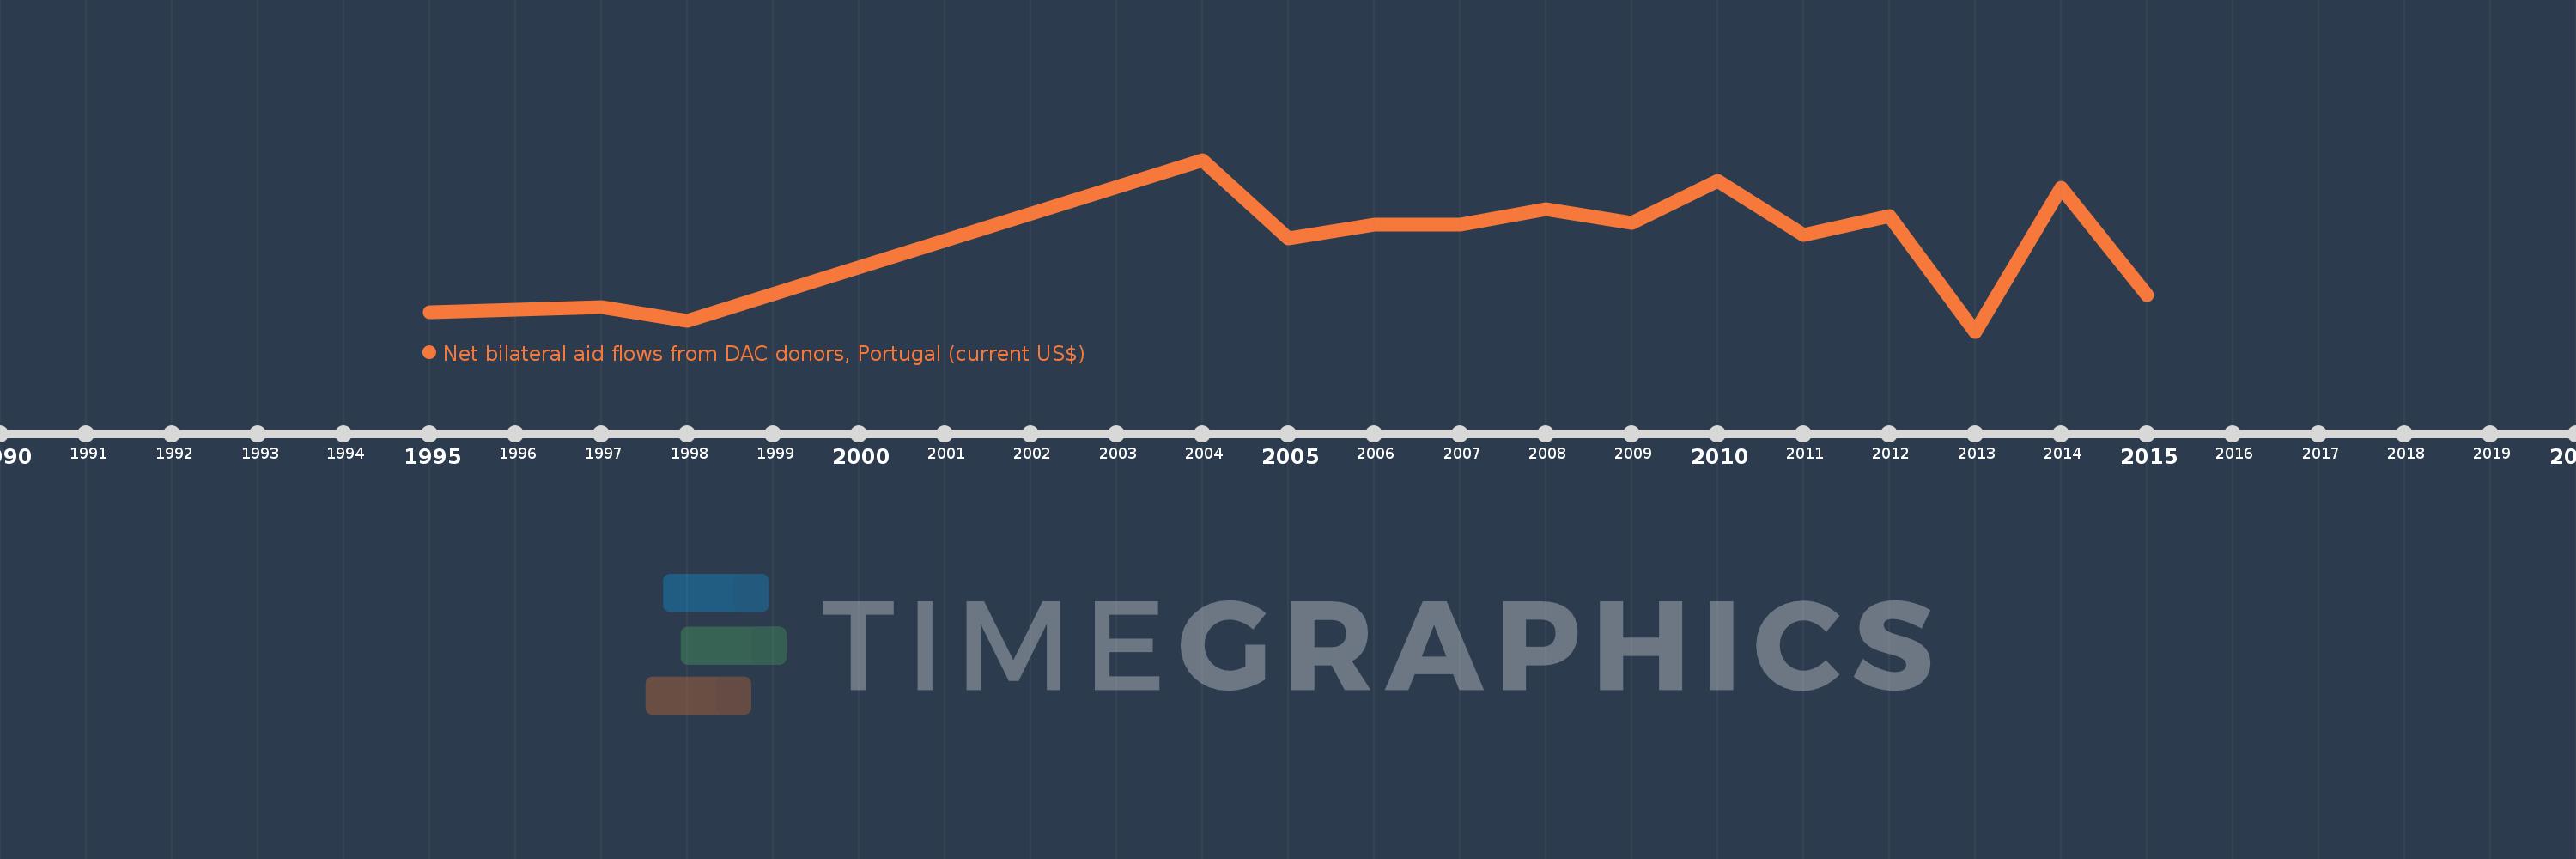
This timeline shows a graph from 1995 to 2015 of Rwanda. No data until 1994. Number of actual observations by date: 15.
Source name:
World Development Indicators
Source organization:
Development Assistance Committee of the Organisation for Economic Co-operation and Development, Geographical Distribution of Financial Flows to Developing Countries, Development Co-operation Report, and International Development Statistics database. Data are available online at: www.oecd.org/dac/stats/idsonline.
Categories, topics:
Aid Effectiveness
Last updated:
apr 23, 2017
Indicators value changes by year
Meaning:
497.333K
Minimum:
0.0
jan 1, 2013
Maximum:
980.0K
jan 1, 2004
At the date of observation
Value
Absolute change
Change from the previous value
jan 1, 1995
110.0K
+110.0K
0.0%
jan 1, 1997
140.0K
+30.0K
27.27%
jan 1, 1998
60.0K
-80.0K
-57.14%
jan 1, 2004
980.0K
+920.0K
1.53K%
jan 1, 2005
530.0K
-450.0K
-45.92%
jan 1, 2006
610.0K
+80.0K
15.09%
jan 1, 2007
610.0K
0.0
0.0%
jan 1, 2008
700.0K
+90.0K
14.75%
jan 1, 2009
620.0K
-80.0K
-11.43%
jan 1, 2010
860.0K
+240.0K
38.71%
jan 1, 2011
550.0K
-310.0K
-36.05%
jan 1, 2012
660.0K
+110.0K
20.0%
jan 1, 2013
0.0
-660.0K
-100.0%
jan 1, 2014
820.0K
+820.0K
%
jan 1, 2015
210.0K
-610.0K
-74.39%
Ranking of countries by current statistics by years