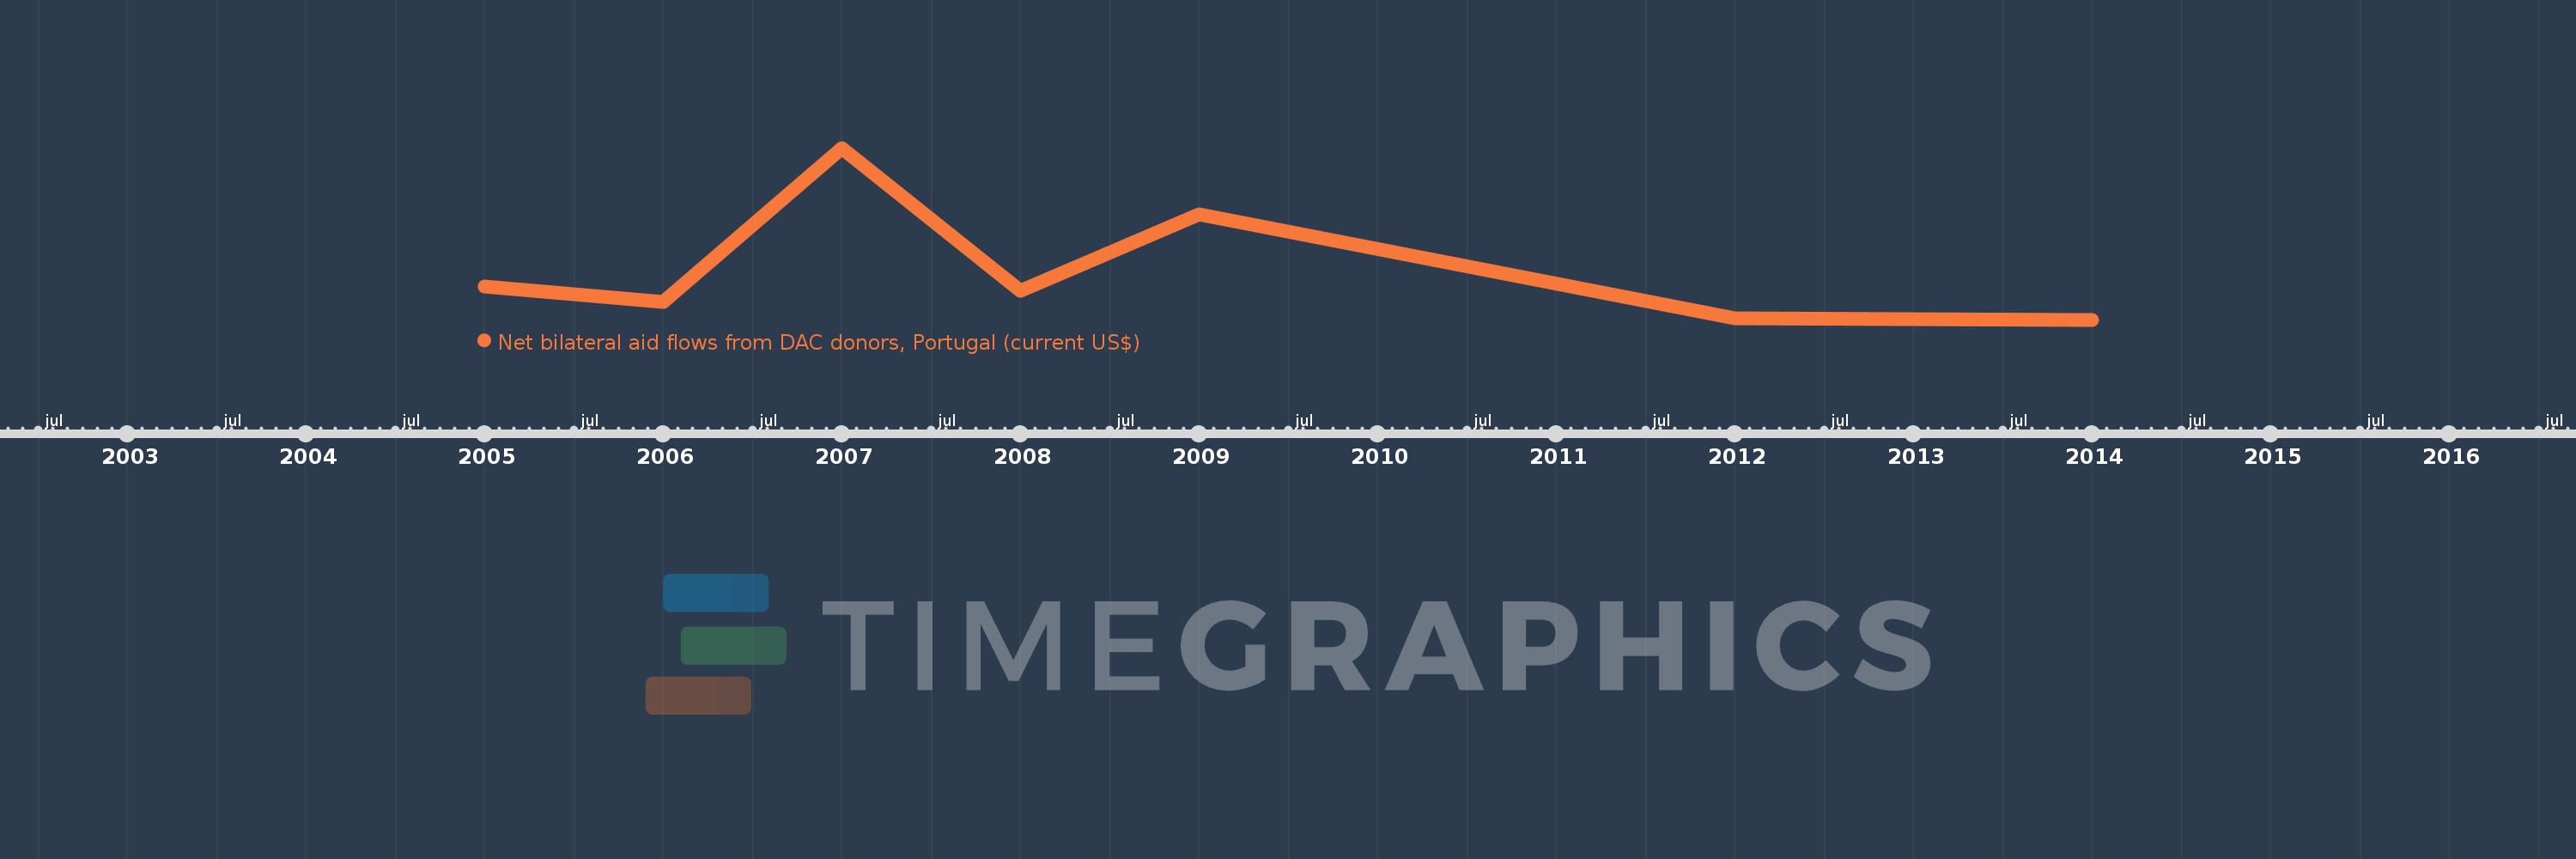
This timeline shows a graph from 2005 to 2014 of Sudan. No data until 2004. Number of actual observations by date: 7.
Source name:
World Development Indicators
Source organization:
Development Assistance Committee of the Organisation for Economic Co-operation and Development, Geographical Distribution of Financial Flows to Developing Countries, Development Co-operation Report, and International Development Statistics database. Data are available online at: www.oecd.org/dac/stats/idsonline.
Categories, topics:
Aid Effectiveness
Last updated:
apr 23, 2017
Indicators value changes by year
Meaning:
494.286K
Minimum:
0.0
jan 1, 2014
Maximum:
1.66 mln
jan 1, 2007
At the date of observation
Value
Absolute change
Change from the previous value
jan 1, 2005
320.0K
+320.0K
0.0%
jan 1, 2006
170.0K
-150.0K
-46.88%
jan 1, 2007
1.66 mln
+1.49 mln
876.47%
jan 1, 2008
280.0K
-1.38 mln
-83.13%
jan 1, 2009
1.02 mln
+740.0K
264.29%
jan 1, 2012
10.0K
-1.01 mln
-99.02%
jan 1, 2014
0.0
-10.0K
-100.0%
Ranking of countries by current statistics by years