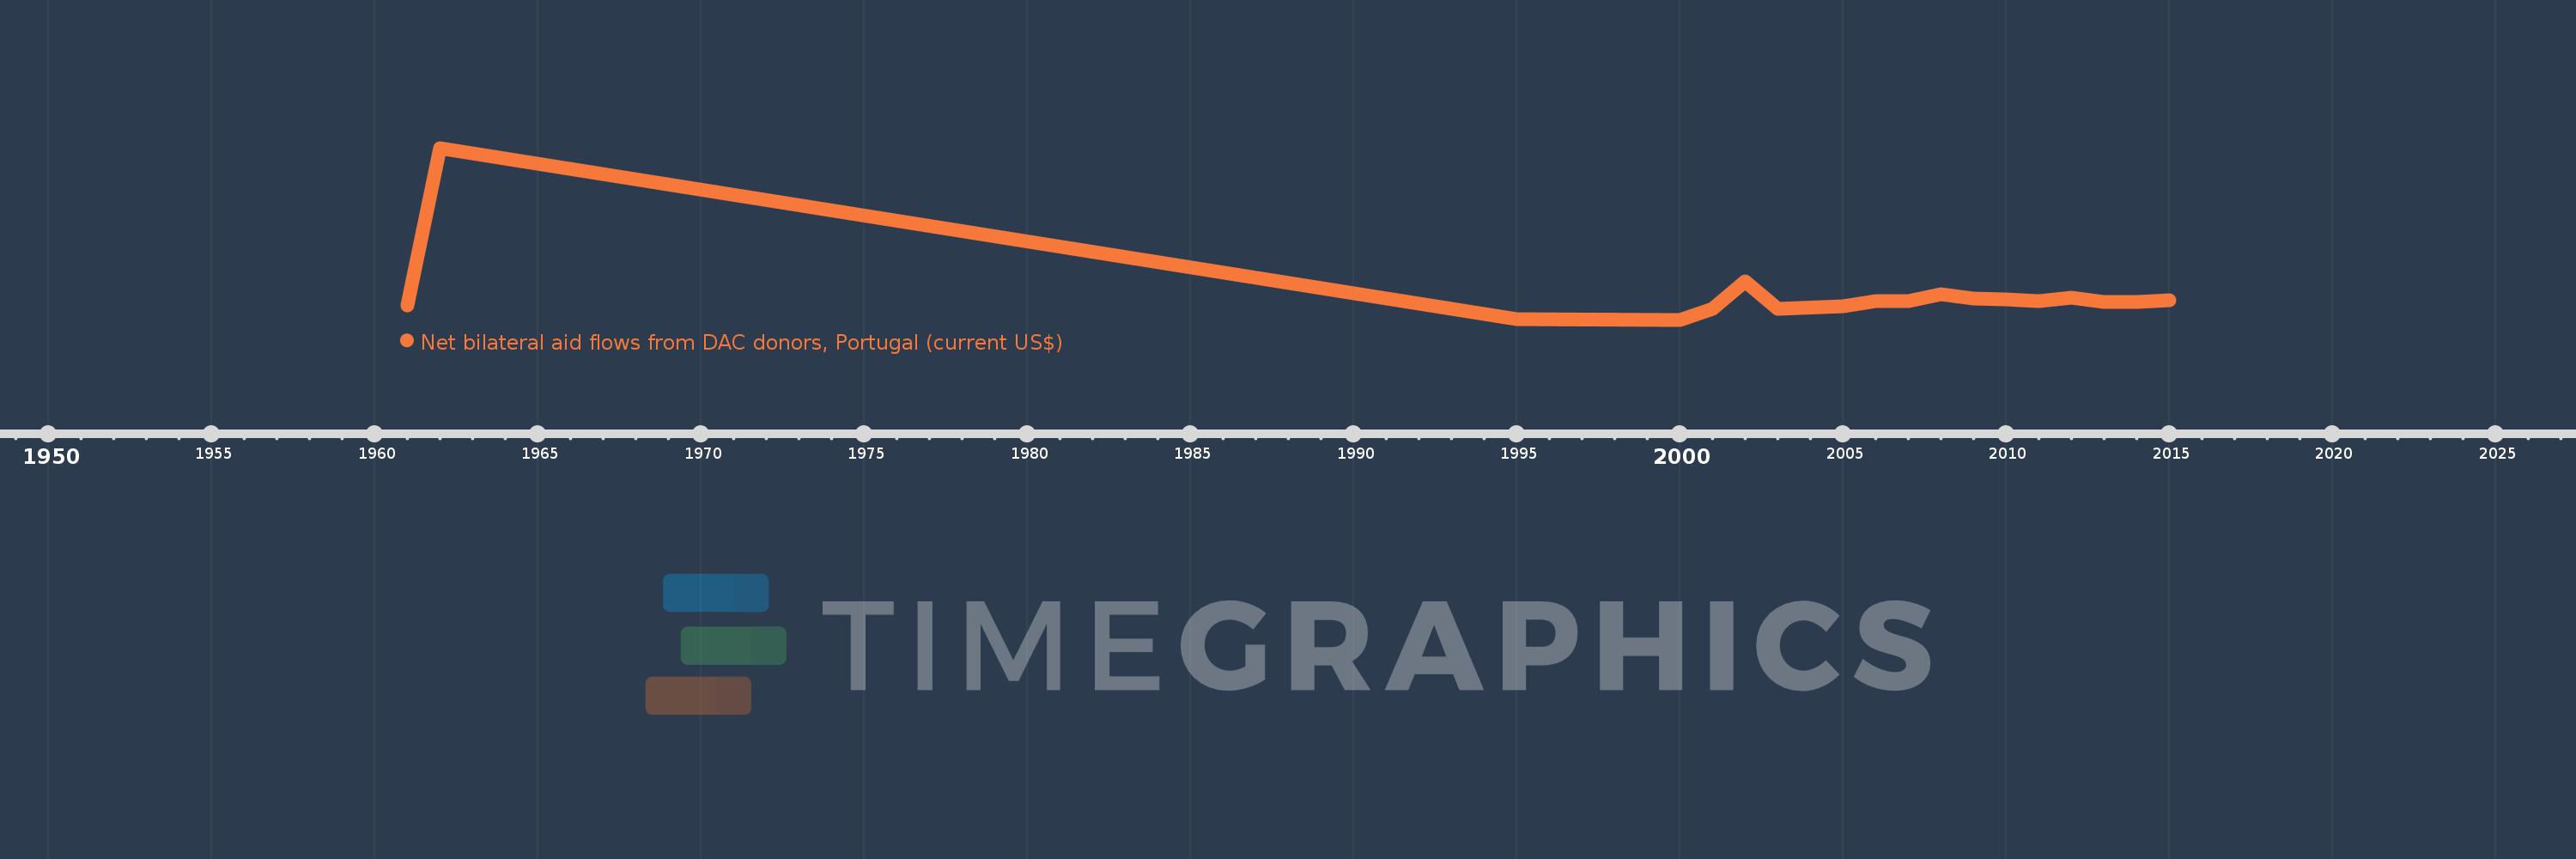
This timeline shows a graph from 1961 to 2015 of India. No data until 1960. Number of actual observations by date: 18.
Source name:
World Development Indicators
Source organization:
Development Assistance Committee of the Organisation for Economic Co-operation and Development, Geographical Distribution of Financial Flows to Developing Countries, Development Co-operation Report, and International Development Statistics database. Data are available online at: www.oecd.org/dac/stats/idsonline.
Categories, topics:
Aid Effectiveness
Last updated:
apr 23, 2017
Indicators value changes by year
Meaning:
525.0K
Minimum:
30.0K
jan 1, 2000
Maximum:
3.36 mln
jan 1, 1962
At the date of observation
Value
Absolute change
Change from the previous value
jan 1, 1961
300.0K
+300.0K
0.0%
jan 1, 1962
3.36 mln
+3.06 mln
1.02K%
jan 1, 1995
40.0K
-3.32 mln
-98.81%
jan 1, 2000
30.0K
-10.0K
-25.0%
jan 1, 2001
240.0K
+210.0K
700.0%
jan 1, 2002
780.0K
+540.0K
225.0%
jan 1, 2003
240.0K
-540.0K
-69.23%
jan 1, 2005
290.0K
+50.0K
20.83%
jan 1, 2006
390.0K
+100.0K
34.48%
jan 1, 2007
390.0K
0.0
0.0%
jan 1, 2008
520.0K
+130.0K
33.33%
jan 1, 2009
440.0K
-80.0K
-15.38%
jan 1, 2010
420.0K
-20.0K
-4.55%
jan 1, 2011
390.0K
-30.0K
-7.14%
jan 1, 2012
460.0K
+70.0K
17.95%
jan 1, 2013
380.0K
-80.0K
-17.39%
jan 1, 2014
380.0K
0.0
0.0%
jan 1, 2015
400.0K
+20.0K
5.26%
Ranking of countries by current statistics by years