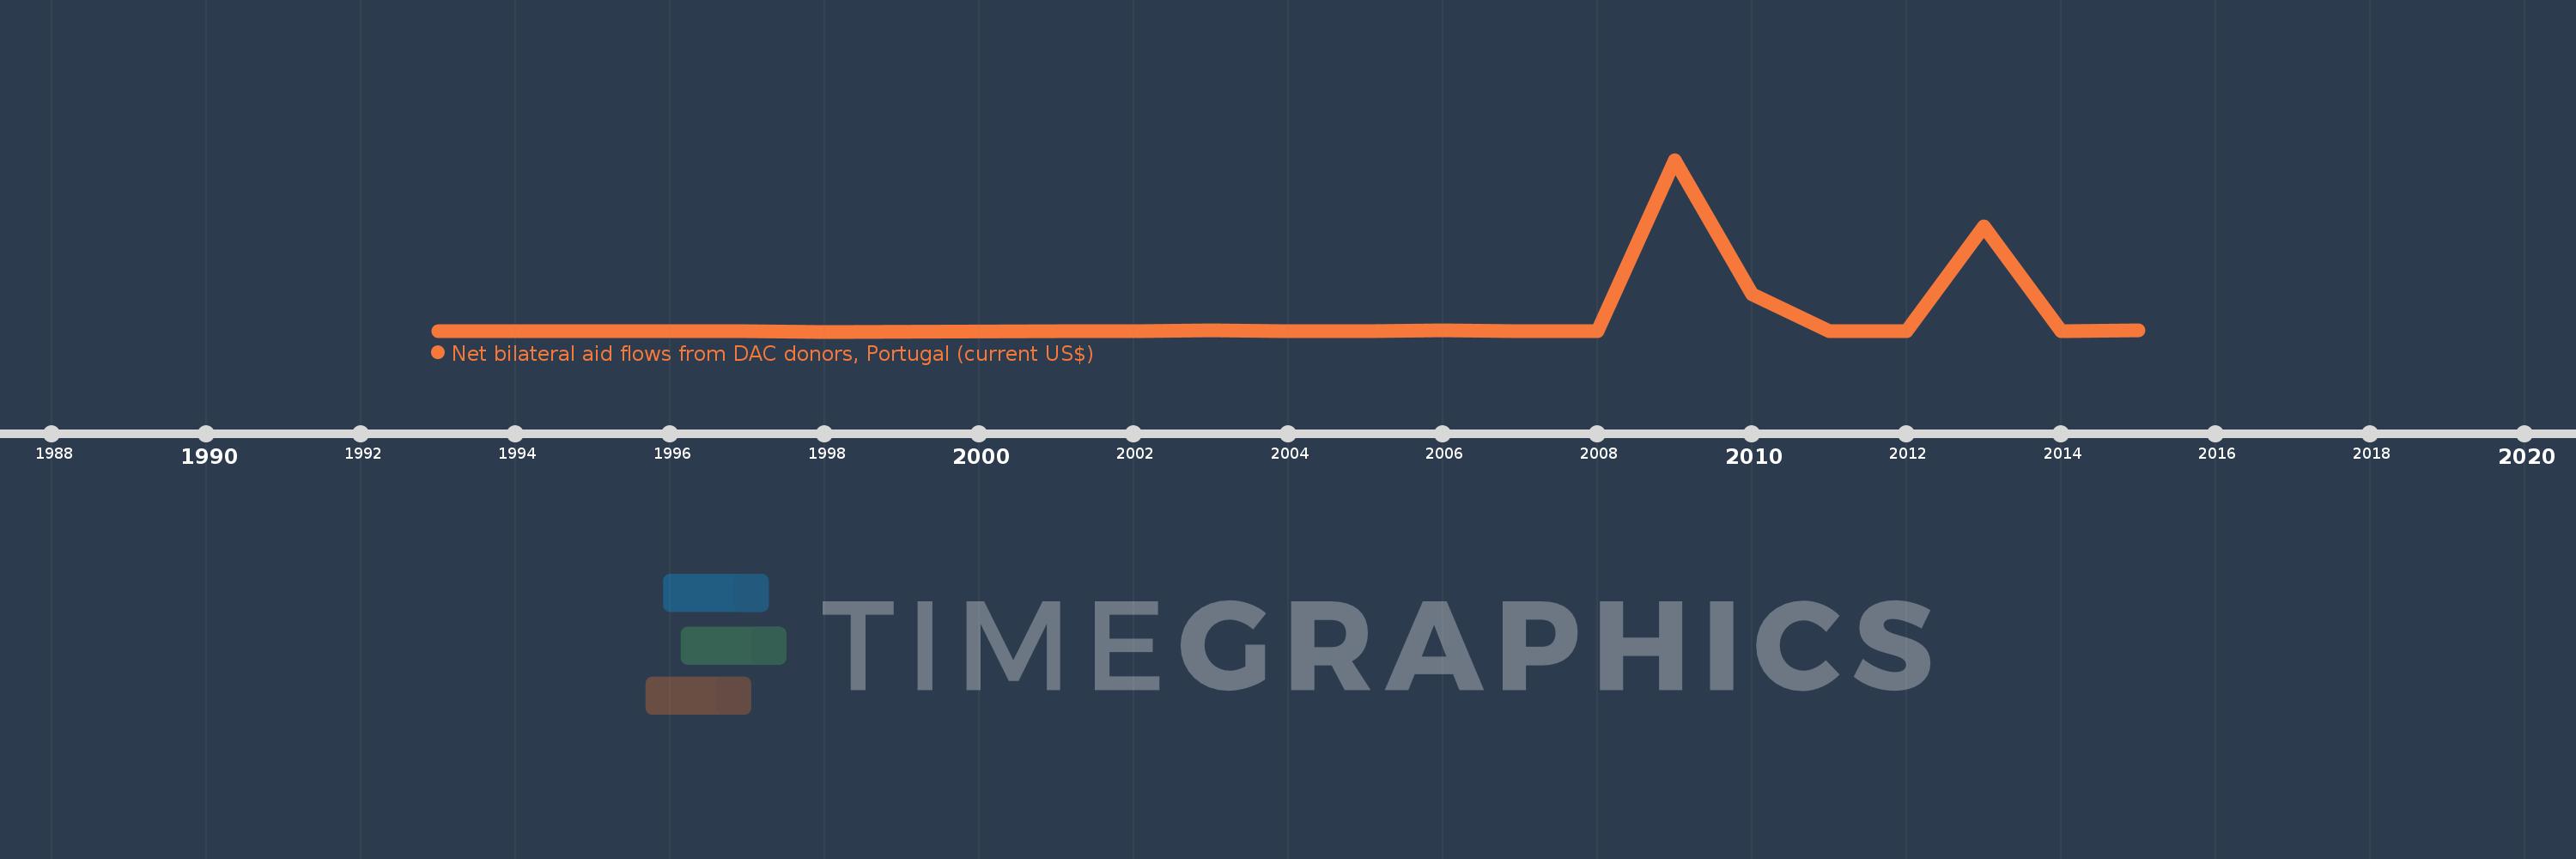
This timeline shows a graph from 1993 to 2015 of Morocco. No data until 1992. Number of actual observations by date: 21.
Source name:
World Development Indicators
Source organization:
Development Assistance Committee of the Organisation for Economic Co-operation and Development, Geographical Distribution of Financial Flows to Developing Countries, Development Co-operation Report, and International Development Statistics database. Data are available online at: www.oecd.org/dac/stats/idsonline.
Categories, topics:
Aid Effectiveness
Last updated:
apr 23, 2017
Indicators value changes by year
Meaning:
8.529 mln
Minimum:
10.0K
jan 1, 1998
Maximum:
95.3 mln
jan 1, 2009
At the date of observation
Value
Absolute change
Change from the previous value
jan 1, 1993
40.0K
+40.0K
0.0%
jan 1, 1994
90.0K
+50.0K
125.0%
jan 1, 1995
440.0K
+350.0K
388.89%
jan 1, 1996
380.0K
-60.0K
-13.64%
jan 1, 1997
110.0K
-270.0K
-71.05%
jan 1, 1998
10.0K
-100.0K
-90.91%
jan 1, 2001
270.0K
+260.0K
2.6K%
jan 1, 2002
250.0K
-20.0K
-7.41%
jan 1, 2003
570.0K
+320.0K
128.0%
jan 1, 2004
70.0K
-500.0K
-87.72%
jan 1, 2005
290.0K
+220.0K
314.29%
jan 1, 2006
830.0K
+540.0K
186.21%
jan 1, 2007
230.0K
-600.0K
-72.29%
jan 1, 2008
260.0K
+30.0K
13.04%
jan 1, 2009
95.3 mln
+95.04 mln
36.55K%
jan 1, 2010
20.66 mln
-74.64 mln
-78.32%
jan 1, 2011
150.0K
-20.51 mln
-99.27%
jan 1, 2012
280.0K
+130.0K
86.67%
jan 1, 2013
58.24 mln
+57.96 mln
20.7K%
jan 1, 2014
140.0K
-58.1 mln
-99.76%
jan 1, 2015
490.0K
+350.0K
250.0%
Ranking of countries by current statistics by years