This timeline shows a graph from 1995 to 2015 of Lebanon. No data until 1994. Number of actual observations by date: 10.
Source name:
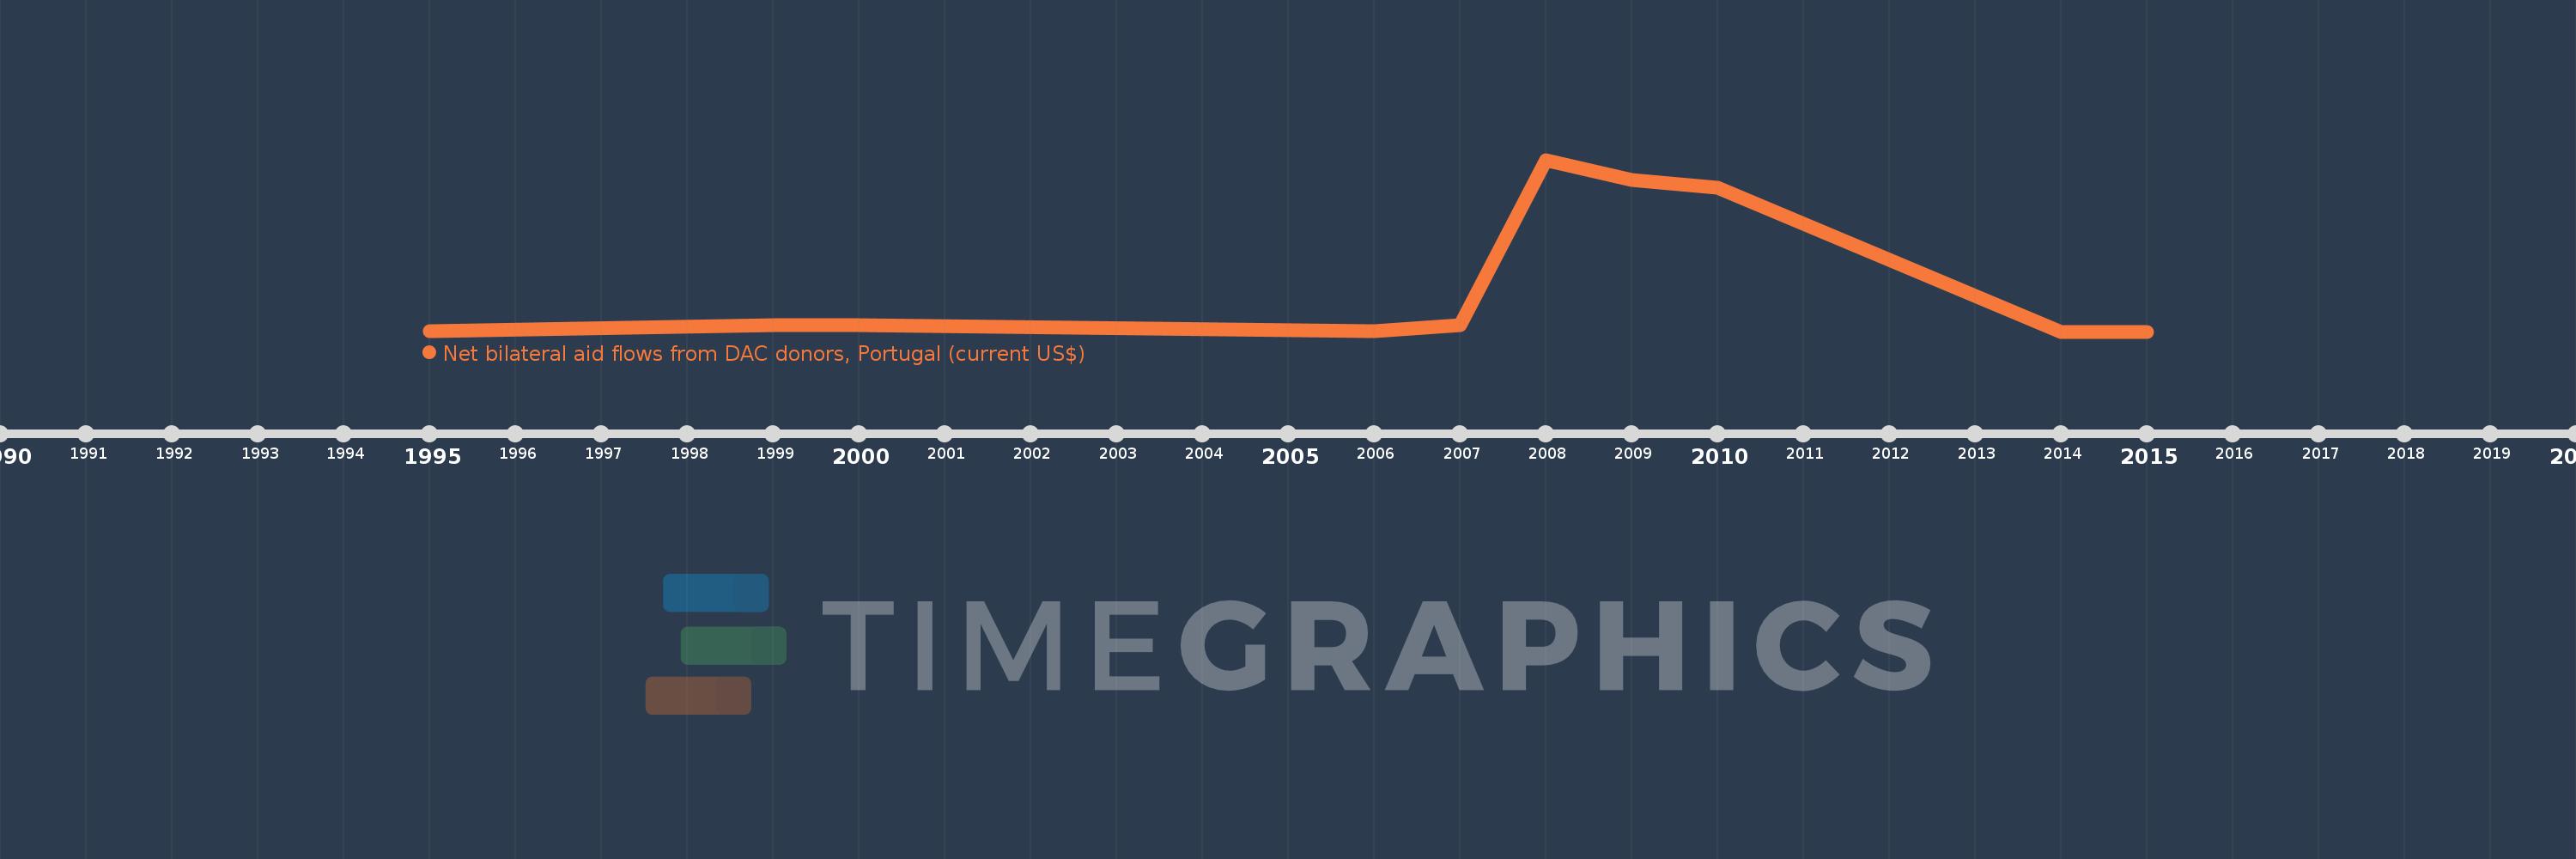
World Development Indicators
Source organization:
Development Assistance Committee of the Organisation for Economic Co-operation and Development, Geographical Distribution of Financial Flows to Developing Countries, Development Co-operation Report, and International Development Statistics database. Data are available online at: www.oecd.org/dac/stats/idsonline.
Categories, topics:
Aid Effectiveness
Last updated:
apr 23, 2017
Indicators value changes by year
Meaning:
3.278 mln
Minimum:
0.0
jan 1, 2014
Maximum:
11.52 mln
jan 1, 2008
At the date of observation
Value
Absolute change
Change from the previous value
jan 1, 1995
50.0K
+50.0K
0.0%
jan 1, 1999
460.0K
+410.0K
820.0%
jan 1, 2000
460.0K
0.0
0.0%
jan 1, 2006
20.0K
-440.0K
-95.65%
jan 1, 2007
430.0K
+410.0K
2.05K%
jan 1, 2008
11.52 mln
+11.09 mln
2.58K%
jan 1, 2009
10.18 mln
-1.34 mln
-11.63%
jan 1, 2010
9.66 mln
-520.0K
-5.11%
jan 1, 2014
0.0
-9.66 mln
-100.0%
jan 1, 2015
0.0
0.0
%
Ranking of countries by current statistics by years