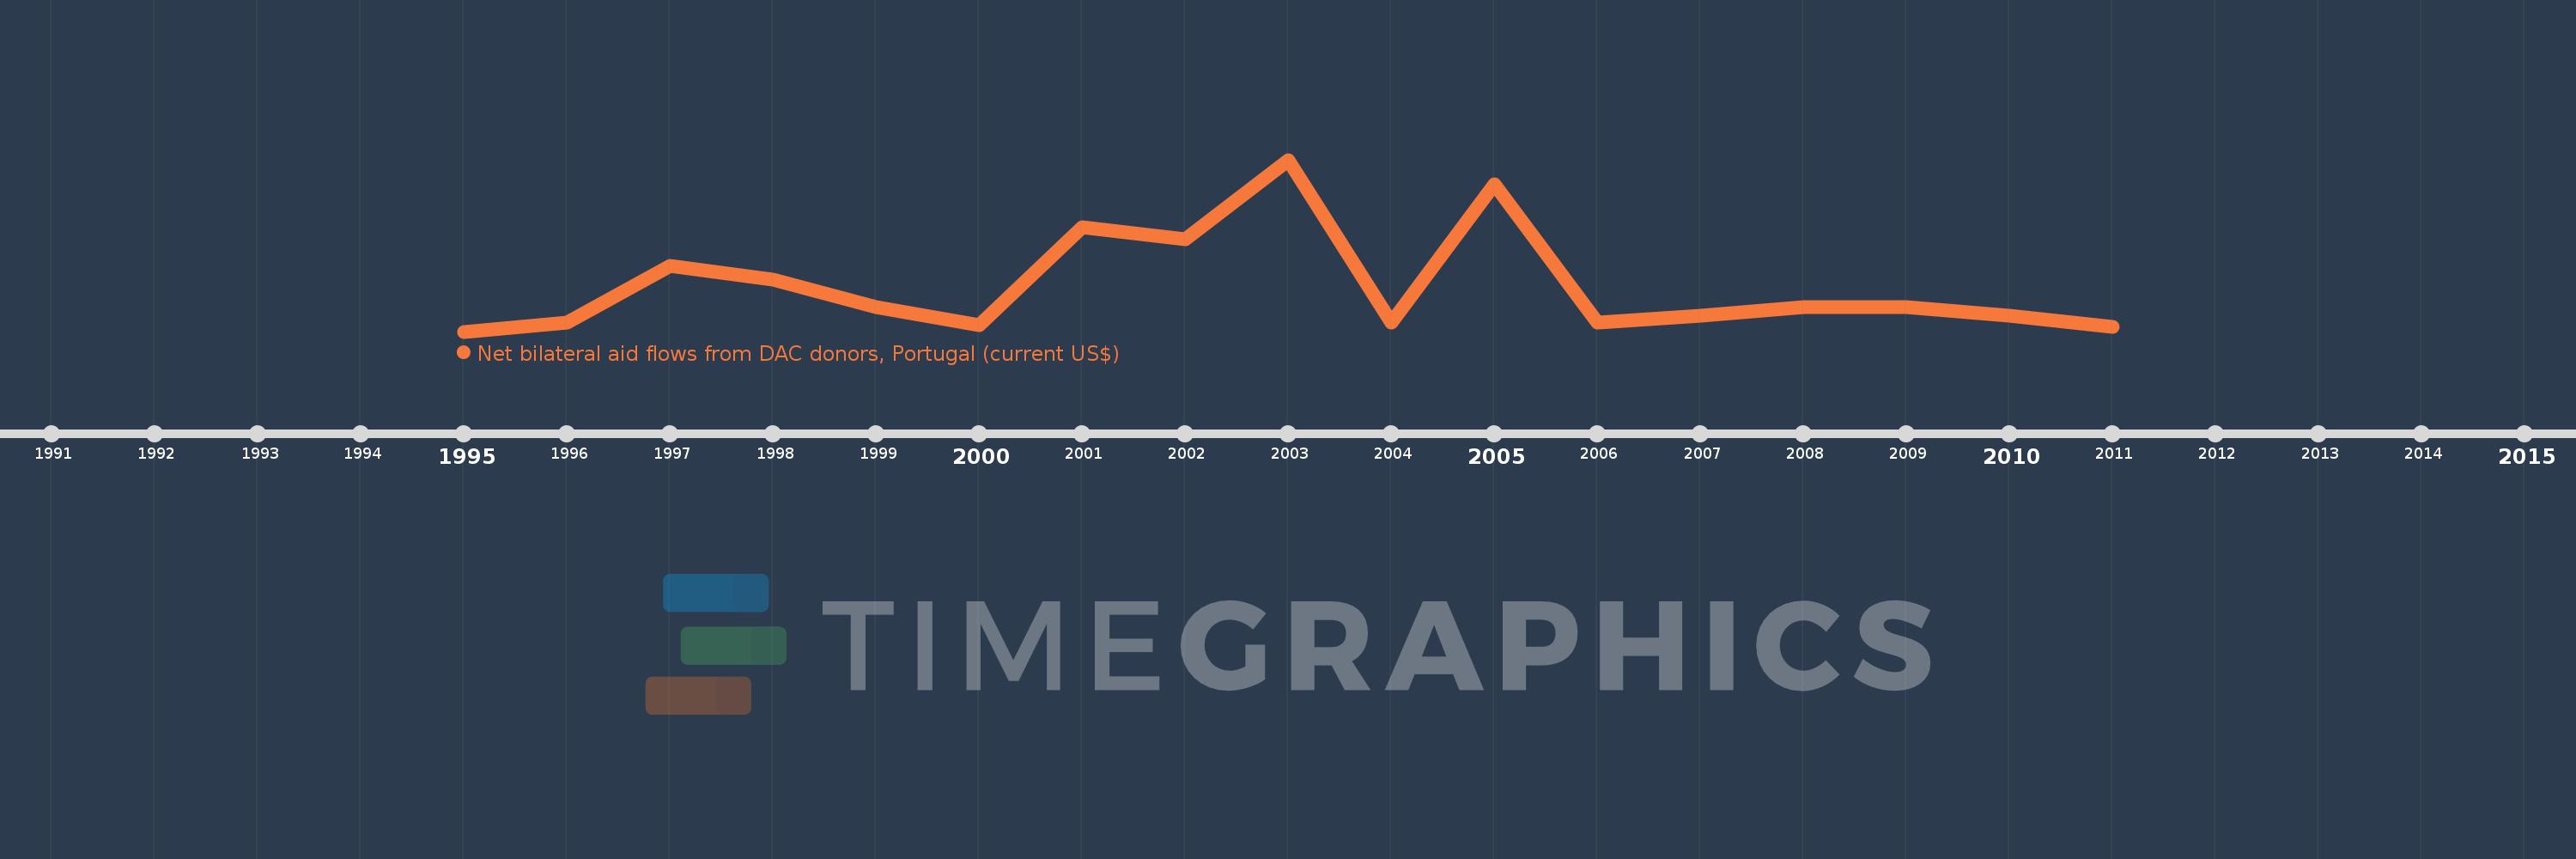
This timeline shows a graph from 1995 to 2011 of European Union. No data until 1994. Number of actual observations by date: 17.
Source name:
World Development Indicators
Source organization:
Development Assistance Committee of the Organisation for Economic Co-operation and Development, Geographical Distribution of Financial Flows to Developing Countries, Development Co-operation Report, and International Development Statistics database. Data are available online at: www.oecd.org/dac/stats/idsonline.
Categories, topics:
Aid Effectiveness
Last updated:
apr 23, 2017
Indicators value changes by year
Meaning:
212.353K
Minimum:
10.0K
jan 1, 1995
Maximum:
770.0K
jan 1, 2003
At the date of observation
Value
Absolute change
Change from the previous value
jan 1, 1995
10.0K
+10.0K
0.0%
jan 1, 1996
50.0K
+40.0K
400.0%
jan 1, 1997
300.0K
+250.0K
500.0%
jan 1, 1998
240.0K
-60.0K
-20.0%
jan 1, 1999
120.0K
-120.0K
-50.0%
jan 1, 2000
40.0K
-80.0K
-66.67%
jan 1, 2001
470.0K
+430.0K
1.07K%
jan 1, 2002
420.0K
-50.0K
-10.64%
jan 1, 2003
770.0K
+350.0K
83.33%
jan 1, 2004
50.0K
-720.0K
-93.51%
jan 1, 2005
660.0K
+610.0K
1.22K%
jan 1, 2006
50.0K
-610.0K
-92.42%
jan 1, 2007
80.0K
+30.0K
60.0%
jan 1, 2008
120.0K
+40.0K
50.0%
jan 1, 2009
120.0K
0.0
0.0%
jan 1, 2010
80.0K
-40.0K
-33.33%
jan 1, 2011
30.0K
-50.0K
-62.5%
Ranking of countries by current statistics by years