Download This statistics in other country:
Timeline:
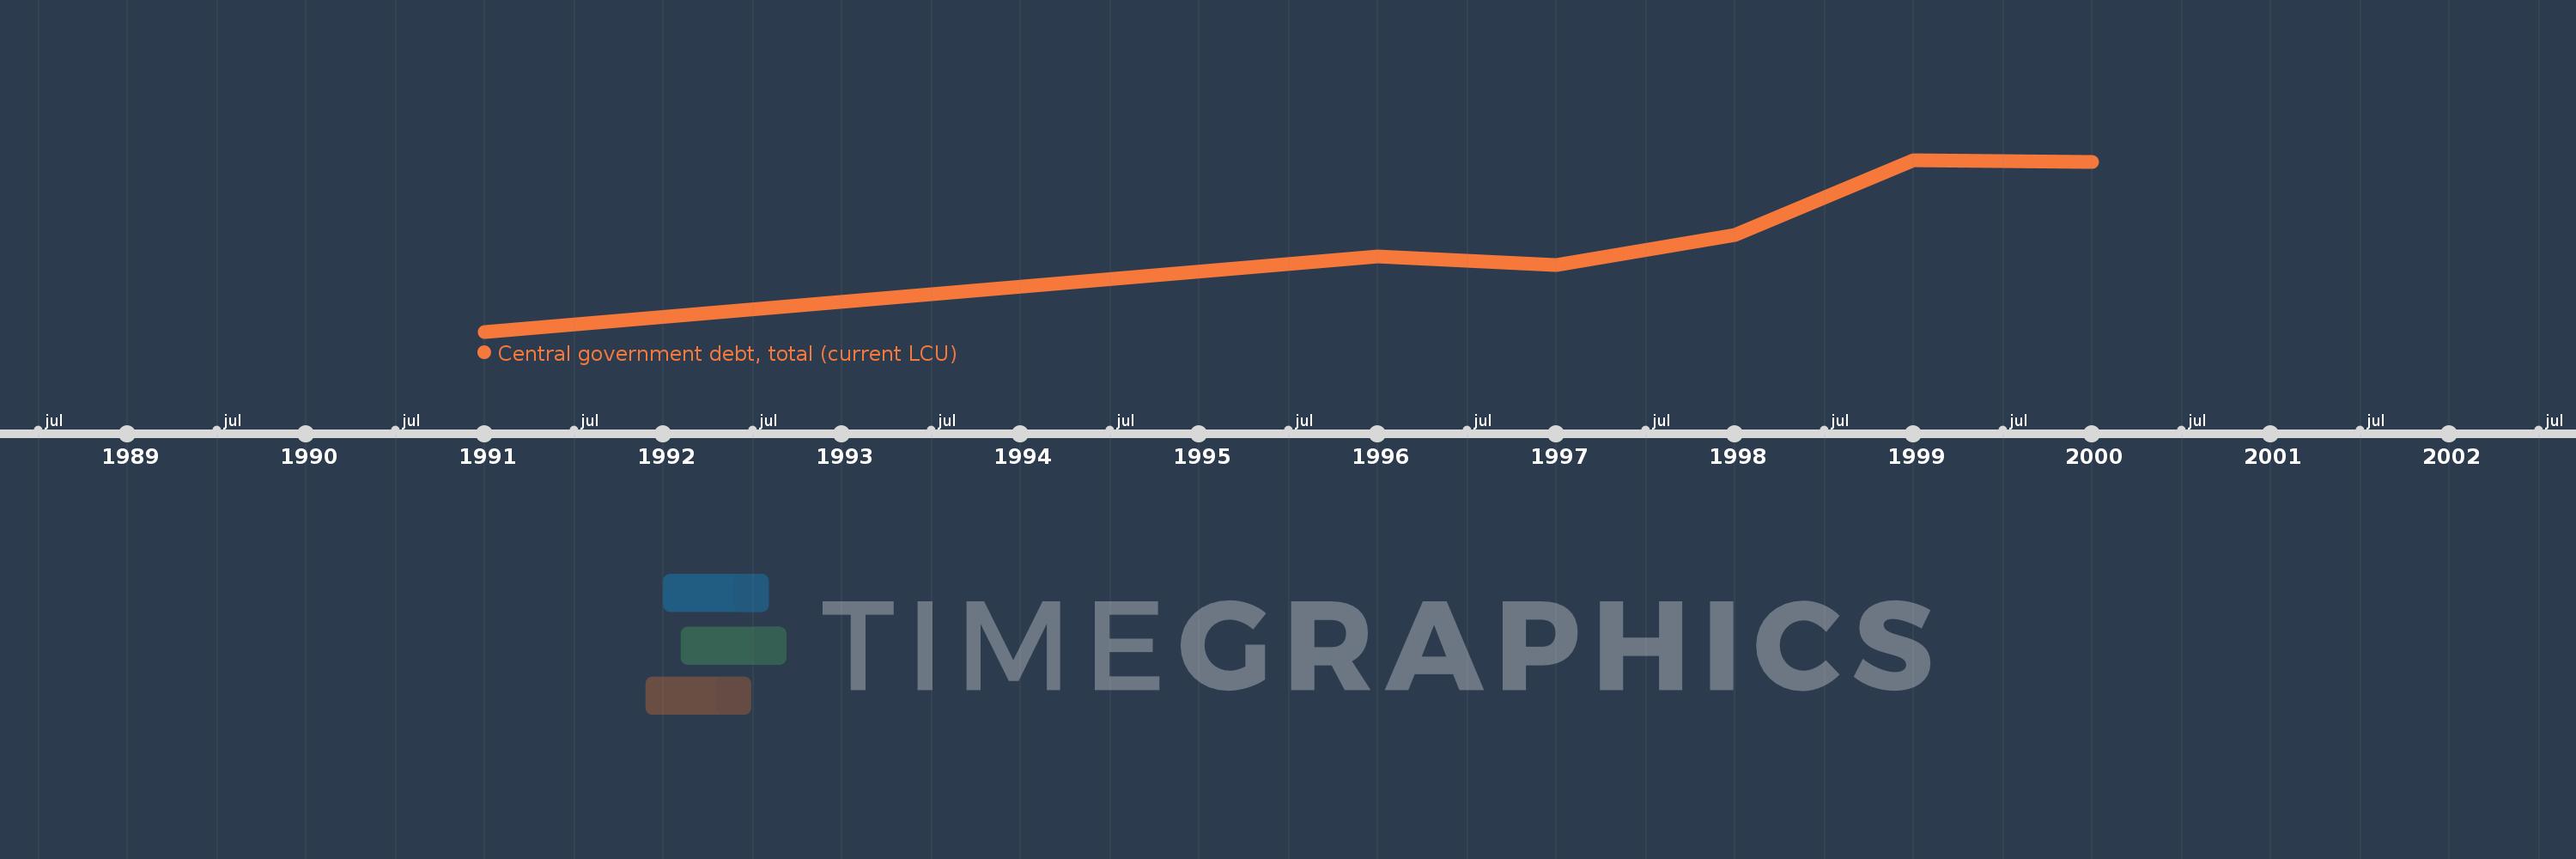
This timeline shows a graph from 1991 to 2000 of Vanuatu. No data until 1990. Number of actual observations by date: 6.
Source name:
World Development Indicators
Source organization:
International Monetary Fund, Government Finance Statistics Yearbook and data files.
Categories, topics:
Public Sector
Last updated:
apr 23, 2017
Indicators value changes by year
Minimum:
4.629 bln
jan 1, 1991
Maximum:
9.5 bln
jan 1, 1999
At the date of observation
Value
Absolute change
Change from the previous value
jan 1, 1991
4.629 bln
+4.629 bln
0.0%
jan 1, 1996
6.76 bln
+2.131 bln
46.03%
jan 1, 1997
6.523 bln
-237.0 mln
-3.51%
jan 1, 1998
7.381 bln
+858.0 mln
13.15%
jan 1, 1999
9.5 bln
+2.119 bln
28.71%
jan 1, 2000
9.445 bln
-55.0 mln
-0.58%
Ranking of countries by current statistics by years