Download This statistics in other country:
Timeline:
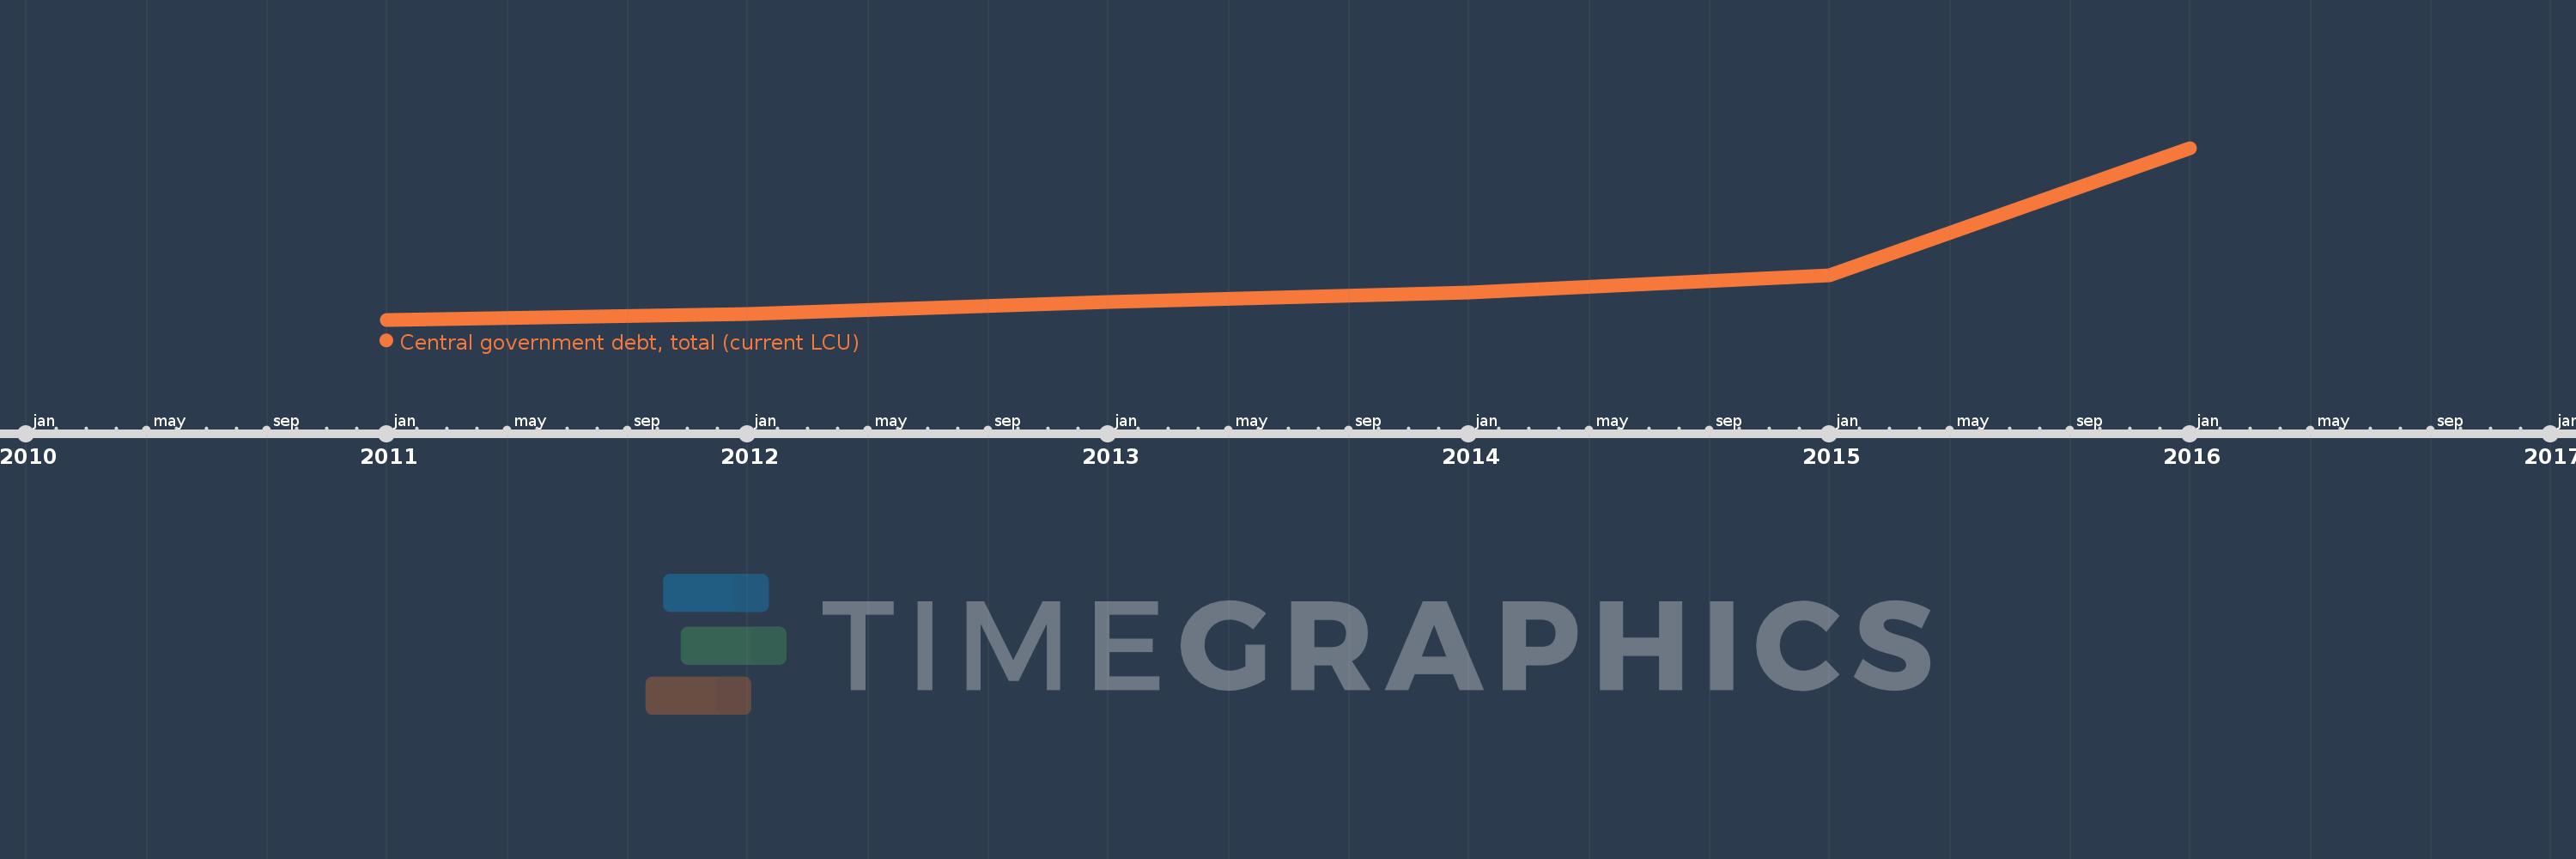
This timeline shows a graph from 2011 to 2016 of Kazakhstan. No data until 2010. Number of actual observations by date: 6.
Source name:
World Development Indicators
Source organization:
International Monetary Fund, Government Finance Statistics Yearbook and data files.
Categories, topics:
Public Sector
Last updated:
apr 23, 2017
Indicators value changes by year
Minimum:
2.077 trl
jan 1, 2011
Maximum:
13.512 trl
jan 1, 2016
At the date of observation
Value
Absolute change
Change from the previous value
jan 1, 2011
2.077 trl
+2.077 trl
0.0%
jan 1, 2012
2.486 trl
+408.275 bln
19.65%
jan 1, 2013
3.256 trl
+770.251 bln
30.99%
jan 1, 2014
3.903 trl
+646.515 bln
19.86%
jan 1, 2015
5.018 trl
+1.115 trl
28.58%
jan 1, 2016
13.512 trl
+8.494 trl
169.28%
Ranking of countries by current statistics by years