Download This statistics in other country:
Timeline:
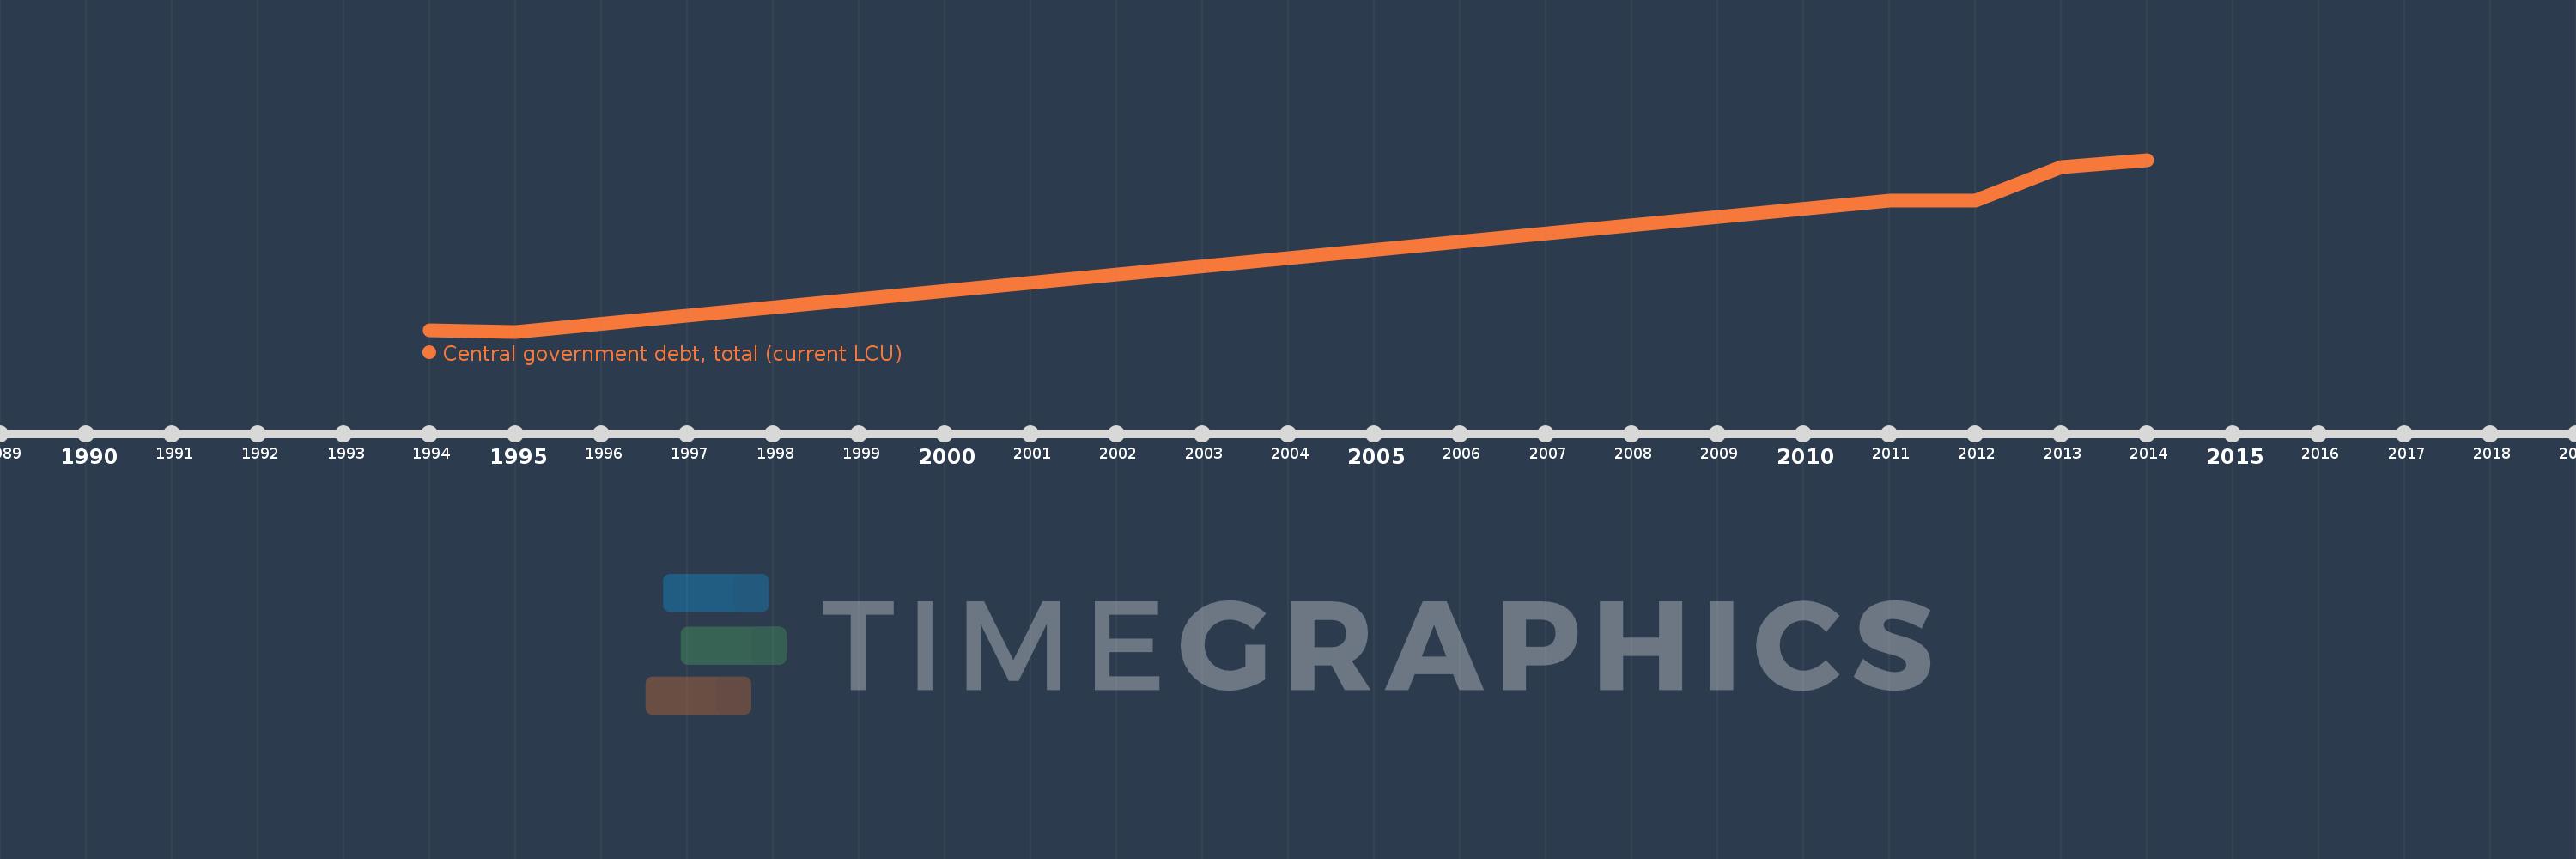
This timeline shows a graph from 1994 to 2014 of Portugal. No data until 1993. Number of actual observations by date: 6.
Source name:
World Development Indicators
Source organization:
International Monetary Fund, Government Finance Statistics Yearbook and data files.
Categories, topics:
Public Sector
Last updated:
apr 23, 2017
Indicators value changes by year
Minimum:
4.67 bln
jan 1, 1995
Maximum:
235.05 bln
jan 1, 2014
At the date of observation
Value
Absolute change
Change from the previous value
jan 1, 1994
6.284 bln
+6.284 bln
0.0%
jan 1, 1995
4.67 bln
-1.614 bln
-25.69%
jan 1, 2011
180.377 bln
+175.707 bln
3.76K%
jan 1, 2012
180.412 bln
+35.8 mln
0.02%
jan 1, 2013
225.454 bln
+45.041 bln
24.97%
jan 1, 2014
235.05 bln
+9.596 bln
4.26%
Ranking of countries by current statistics by years