Download This statistics in other country:
Timeline:
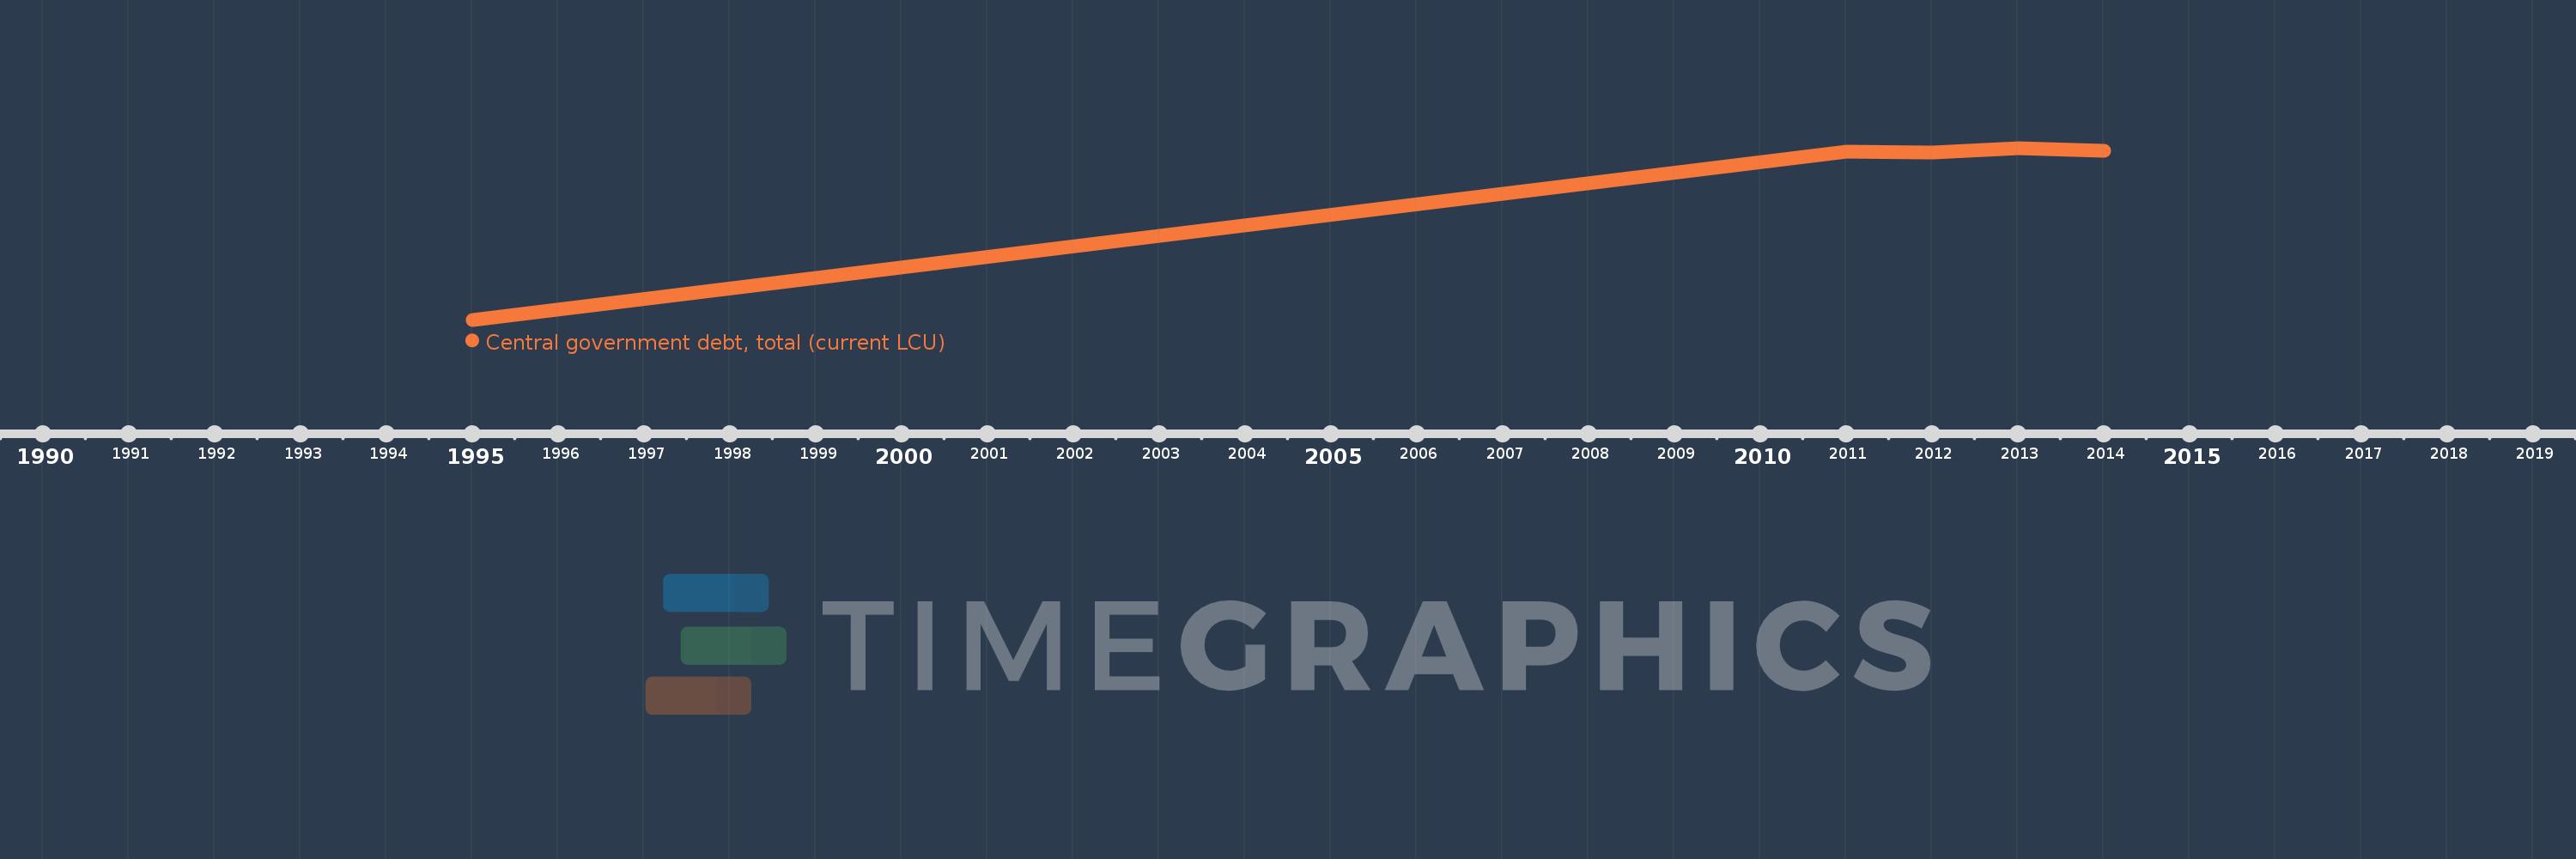
This timeline shows a graph from 1995 to 2014 of Latvia. No data until 1994. Number of actual observations by date: 5.
Source name:
World Development Indicators
Source organization:
International Monetary Fund, Government Finance Statistics Yearbook and data files.
Categories, topics:
Public Sector
Last updated:
apr 23, 2017
Indicators value changes by year
Minimum:
325.226 mln
jan 1, 1995
Maximum:
13.742 bln
jan 1, 2013
At the date of observation
Value
Absolute change
Change from the previous value
jan 1, 1995
325.226 mln
+325.226 mln
0.0%
jan 1, 2011
13.477 bln
+13.152 bln
4.04K%
jan 1, 2012
13.388 bln
-89.641 mln
-0.67%
jan 1, 2013
13.742 bln
+354.295 mln
2.65%
jan 1, 2014
13.539 bln
-203.471 mln
-1.48%
Ranking of countries by current statistics by years