33
/
AIzaSyB4mHJ5NPEv-XzF7P6NDYXjlkCWaeKw5bc
November 30, 2025
219357
Papua New Guinea
PNG
true
2
1
Central government debt, total (current LCU)
2003,2002,2001,2000,1999,1998,1997,1996,1995,1994,1993,1992,1991
Create a timeline
Public Timelines
For education
For educational institutions
For teachers
For students
Cabinet
For educational institutions
For teachers
For students
Open cabinet
FAQ
Close
Create a timeline
Public timelines
FAQ
About & Feedback
Terms
Privacy
FAQ
Support 24/7
Cabinet
Get premium
Donate
Download
Global statistics library
→
Papua New Guinea
→
Central government debt, total (current LCU)
This statistics in other country:
Albania
Algeria
Antigua and Barbuda
Australia
Austria
Azerbaijan
Bahrain
Bangladesh
Barbados
Belarus
Belgium
Belize
Bhutan
Bolivia
Bosnia and Herzegovina
Botswana
Brazil
Bulgaria
Burundi
Canada
Colombia
Congo, Dem. Rep.
Congo, Rep.
Costa Rica
Cote d'Ivoire
Cyprus
Czech Republic
Denmark
Dominica
Dominican Republic
Egypt, Arab Rep.
El Salvador
Estonia
Ethiopia
Fiji
Finland
France
Georgia
Germany
Greece
Guatemala
Hong Kong SAR, China
Hungary
Iceland
India
Indonesia
Ireland
Israel
Italy
Jamaica
Japan
Jordan
Kazakhstan
Kenya
Korea, Rep.
Kyrgyz Republic
Latvia
Lebanon
Lesotho
Liberia
Lithuania
Luxembourg
Madagascar
Malawi
Malaysia
Maldives
Malta
Mauritius
Mexico
Micronesia, Fed. Sts.
Moldova
Mongolia
Morocco
Namibia
Nepal
Netherlands
New Zealand
Nigeria
Norway
Oman
Pakistan
Papua New Guinea
Peru
Philippines
Poland
Portugal
Romania
Russian Federation
Rwanda
Samoa
San Marino
Senegal
Seychelles
Sierra Leone
Singapore
Slovak Republic
Slovenia
Solomon Islands
South Africa
Spain
Sri Lanka
St. Kitts and Nevis
Swaziland
Sweden
Switzerland
Tajikistan
Thailand
Trinidad and Tobago
Tunisia
Turkey
Uganda
Ukraine
United Arab Emirates
United Kingdom
United States
Uruguay
Vanuatu
Zambia
Zimbabwe
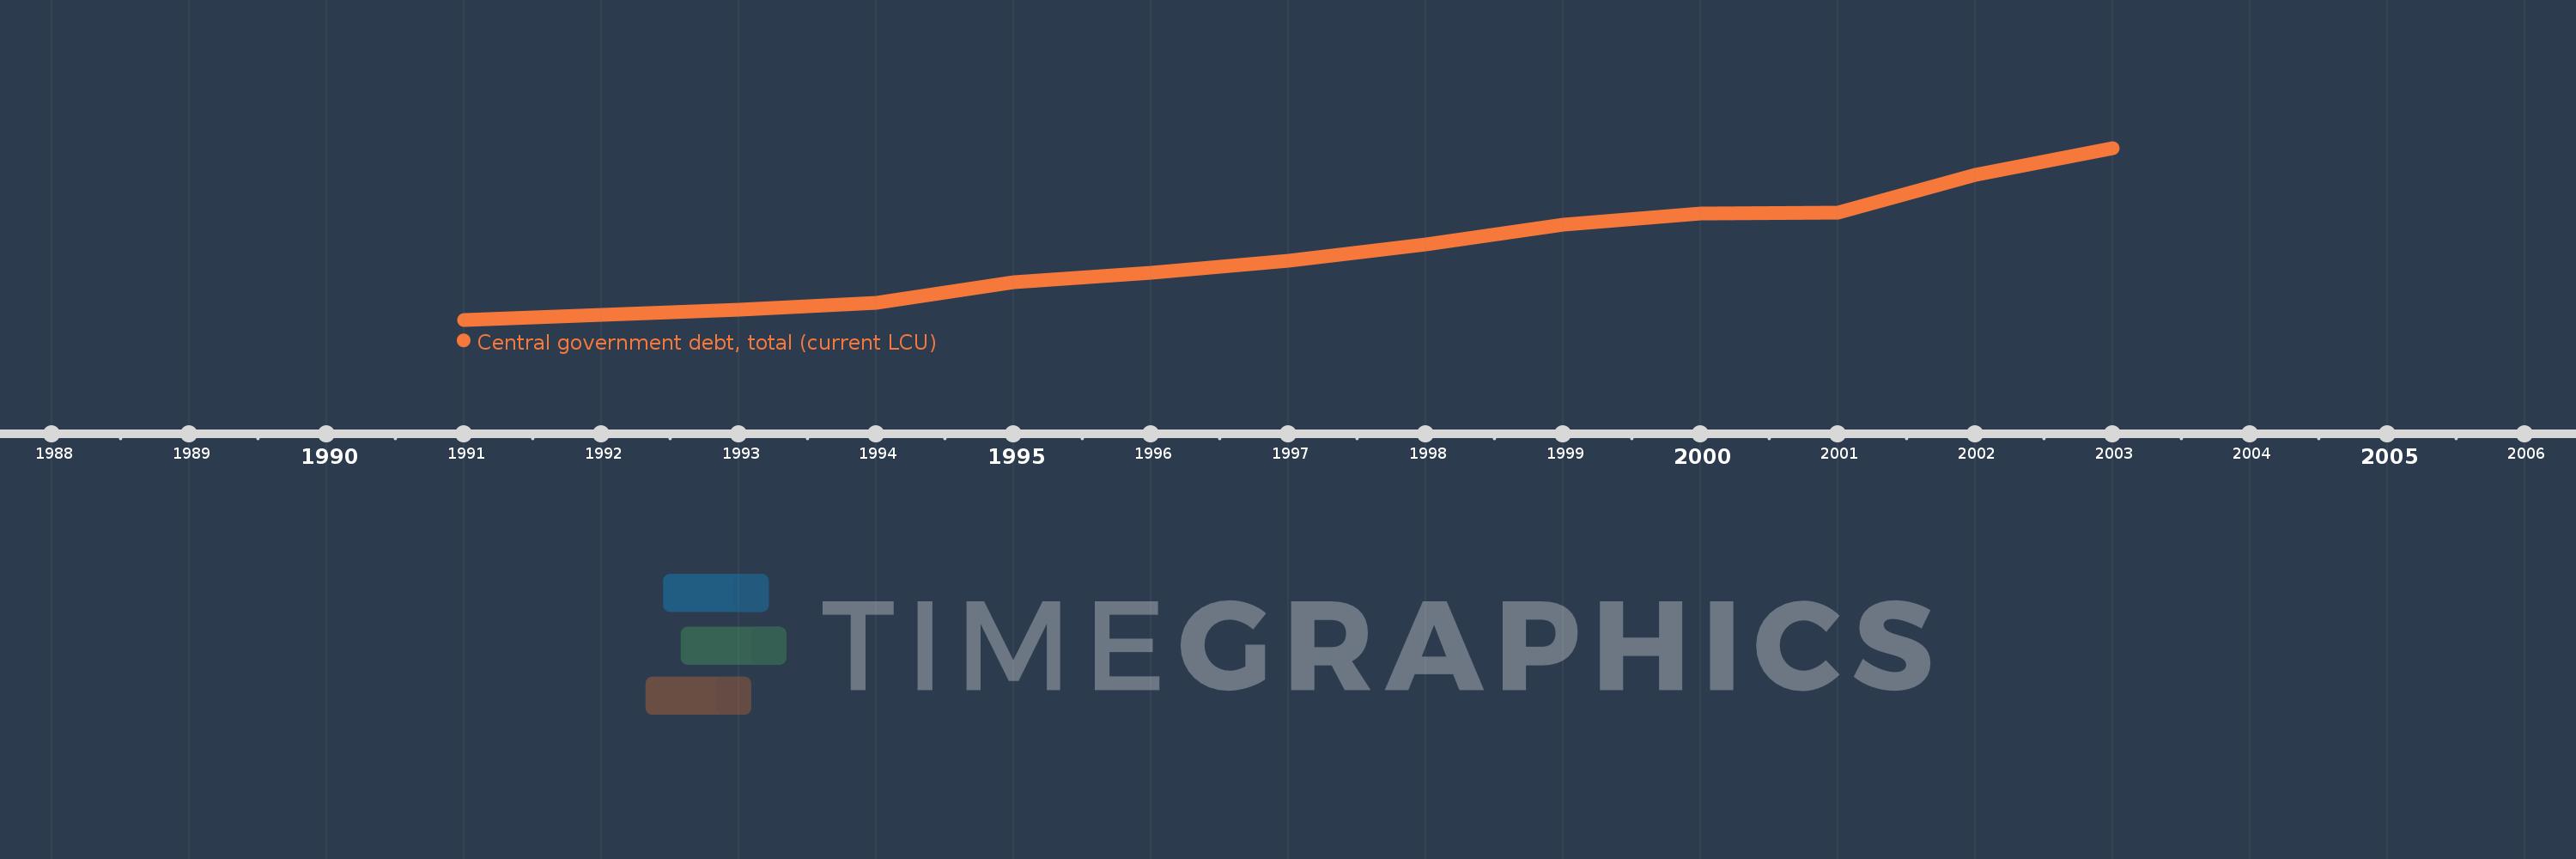
Timeline:
This timeline shows a graph from
1991
to
2003
of Papua New Guinea. No data until
1990
. Number of actual observations by date:
13
.
Source name:
World Development Indicators
Source organization:
International Monetary Fund, Government Finance Statistics Yearbook and data files.
Categories, topics:
Public Sector
Last updated:
apr 23, 2017
Indicators value changes by year
Meaning:
4.104 bln
Minimum:
1.506 bln
jan 1, 1991
Maximum:
8.128 bln
jan 1, 2003
At the date of observation
Value
Absolute change
Change from the previous value
jan 1, 1991
1.506 bln
+1.506 bln
0.0%
jan 1, 1992
1.681 bln
+174.7 mln
11.6%
jan 1, 1993
1.895 bln
+214.02 mln
12.73%
jan 1, 1994
2.157 bln
+262.78 mln
13.87%
jan 1, 1995
2.961 bln
+803.8 mln
37.26%
jan 1, 1996
3.324 bln
+363.0 mln
12.26%
jan 1, 1997
3.781 bln
+456.6 mln
13.74%
jan 1, 1998
4.418 bln
+637.2 mln
16.85%
jan 1, 1999
5.178 bln
+759.7 mln
17.2%
jan 1, 2000
5.609 bln
+431.5 mln
8.33%
jan 1, 2001
5.622 bln
+12.4 mln
0.22%
jan 1, 2002
7.097 bln
+1.476 bln
26.25%
jan 1, 2003
8.128 bln
+1.031 bln
14.52%
Ranking of countries by current statistics by years
About & Feedback
Terms
Privacy
FAQ
Support 24/7
Cabinet
Get premium
Donate
The service accepts bank transfer (ACH, Wire) or cards (Visa, MasterCard, etc). Processed by Stripe.
Secured with SSL