Download This statistics in other country:
Timeline:
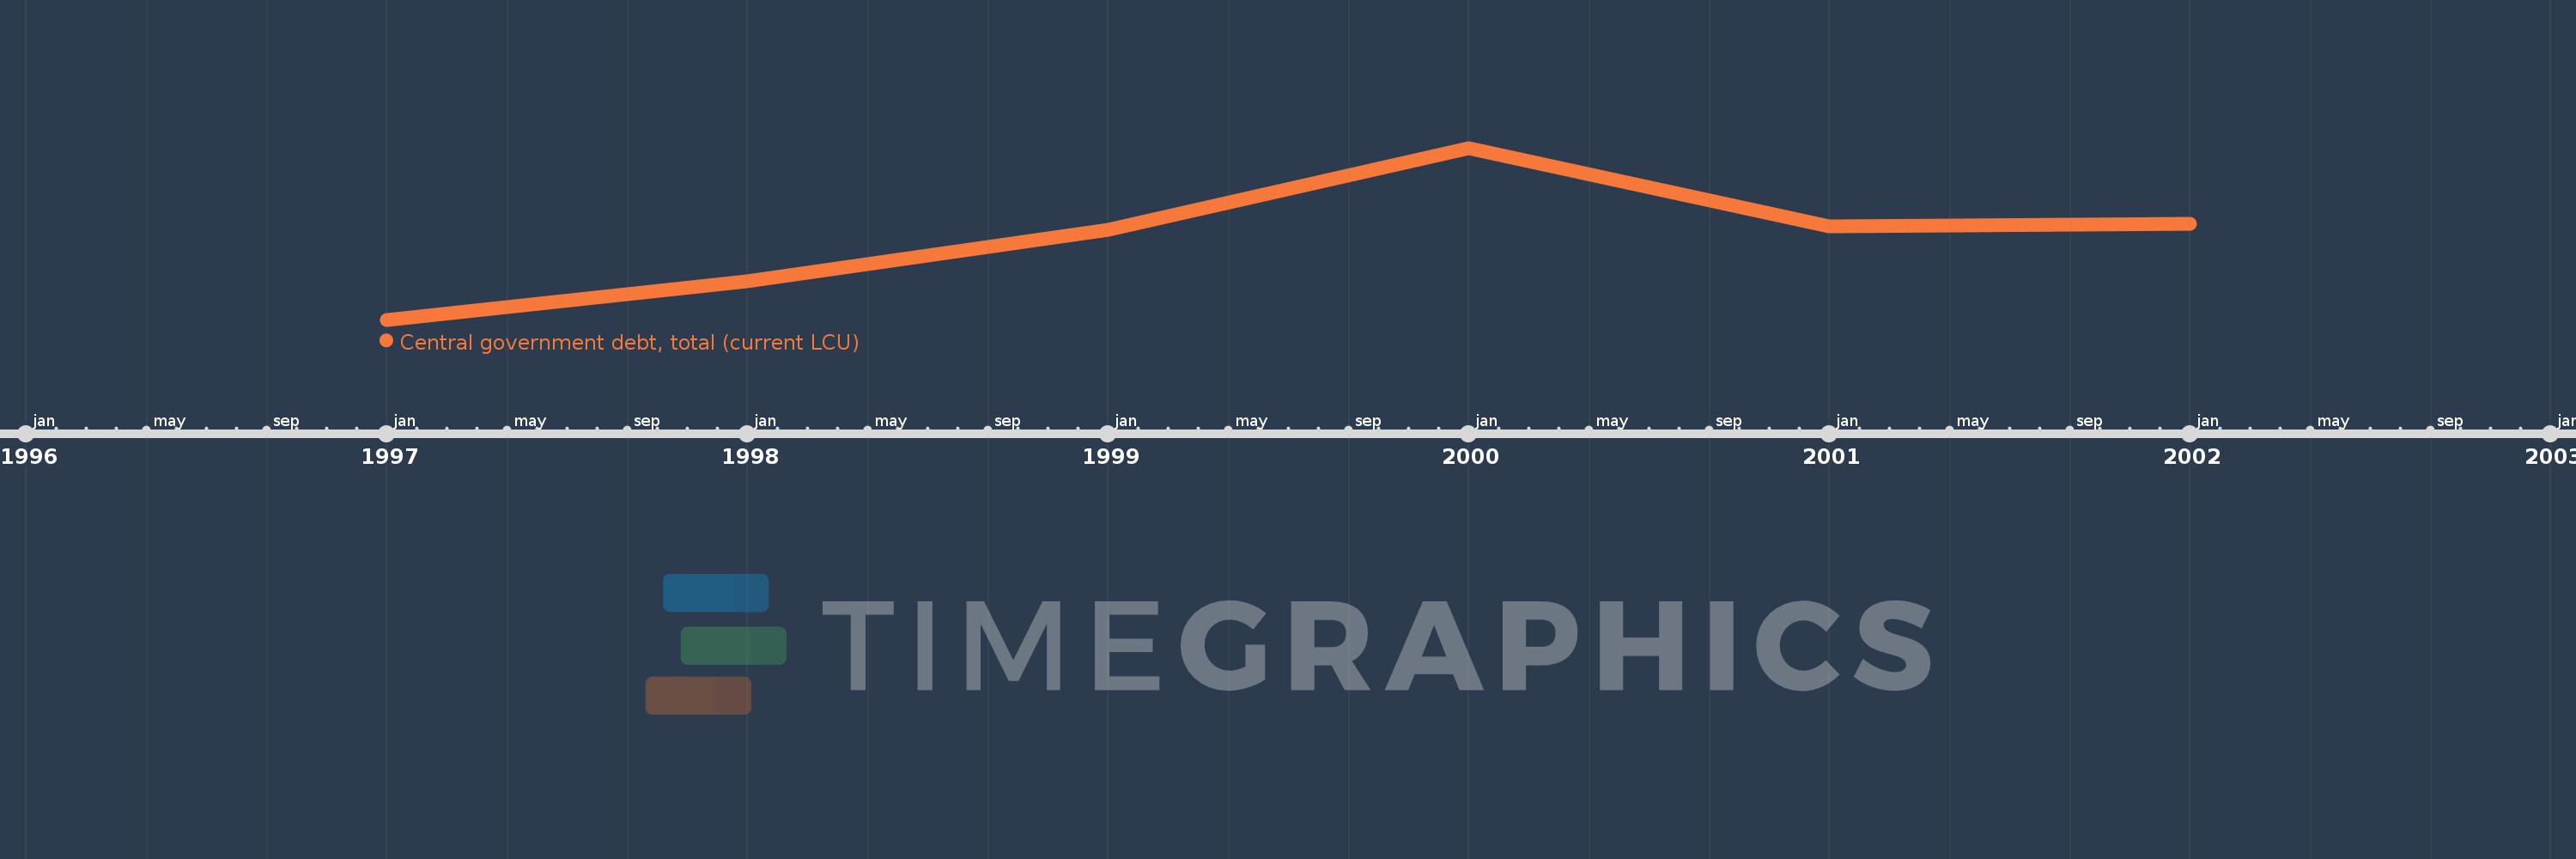
This timeline shows a graph from 1997 to 2002 of Senegal. No data until 1996. Number of actual observations by date: 6.
Source name:
World Development Indicators
Source organization:
International Monetary Fund, Government Finance Statistics Yearbook and data files.
Categories, topics:
Public Sector
Last updated:
apr 23, 2017
Indicators value changes by year
Minimum:
2.228 trl
jan 1, 1997
Maximum:
2.648 trl
jan 1, 2000
At the date of observation
Value
Absolute change
Change from the previous value
jan 1, 1997
2.228 trl
+2.228 trl
0.0%
jan 1, 1998
2.322 trl
+94.0 bln
4.22%
jan 1, 1999
2.449 trl
+126.3 bln
5.44%
jan 1, 2000
2.648 trl
+199.7 bln
8.16%
jan 1, 2001
2.456 trl
-191.9 bln
-7.25%
jan 1, 2002
2.462 trl
+5.5 bln
0.22%
Ranking of countries by current statistics by years