Download This statistics in other country:
Timeline:
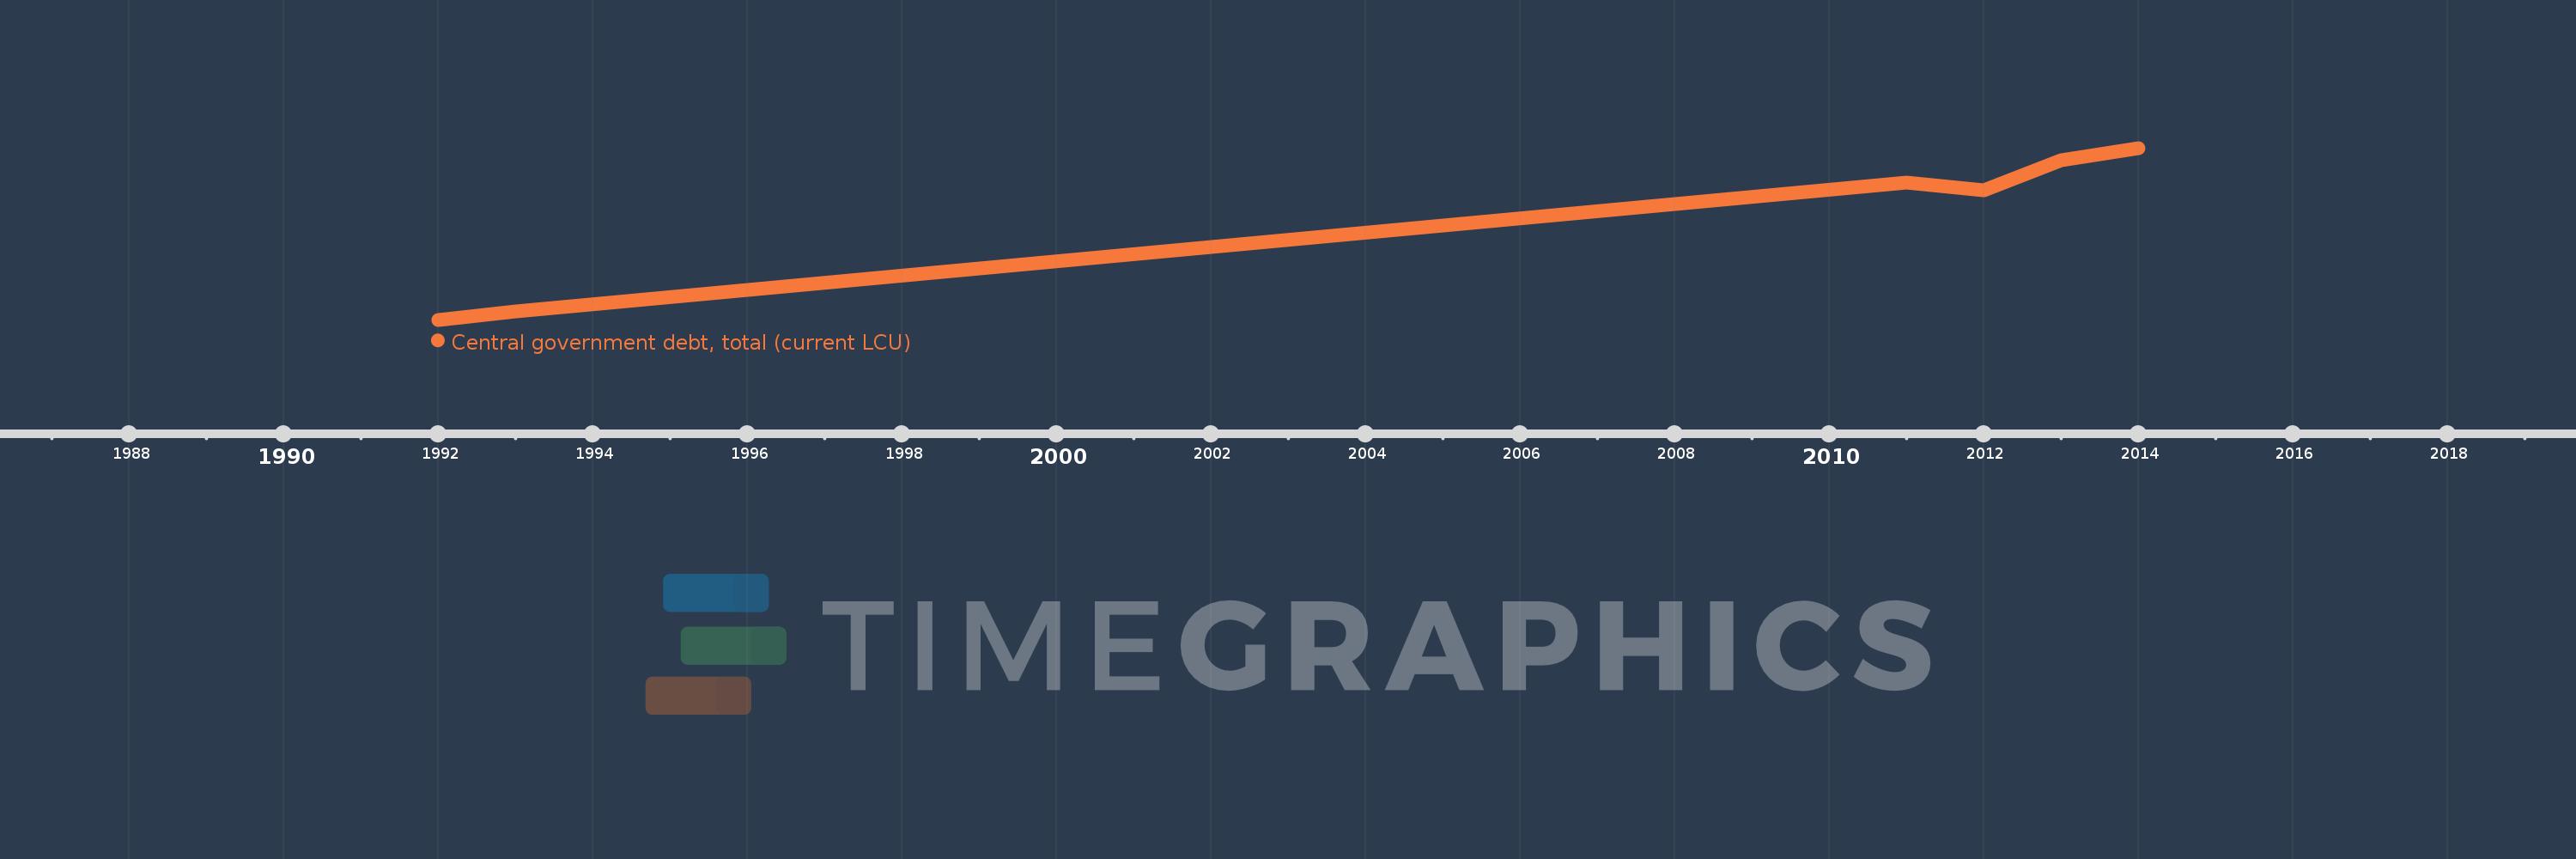
This timeline shows a graph from 1992 to 2014 of Italy. No data until 1991. Number of actual observations by date: 6.
Source name:
World Development Indicators
Source organization:
International Monetary Fund, Government Finance Statistics Yearbook and data files.
Categories, topics:
Public Sector
Last updated:
apr 23, 2017
Indicators value changes by year
Minimum:
570.28 bln
jan 1, 1992
Maximum:
2.164 trl
jan 1, 2014
At the date of observation
Value
Absolute change
Change from the previous value
jan 1, 1992
570.28 bln
+570.28 bln
0.0%
jan 1, 1993
650.914 bln
+80.634 bln
14.14%
jan 1, 2011
1.84 trl
+1.189 trl
182.69%
jan 1, 2012
1.774 trl
-65.906 bln
-3.58%
jan 1, 2013
2.049 trl
+275.247 bln
15.51%
jan 1, 2014
2.164 trl
+114.314 bln
5.58%
Ranking of countries by current statistics by years