Download This statistics in other country:
Timeline:
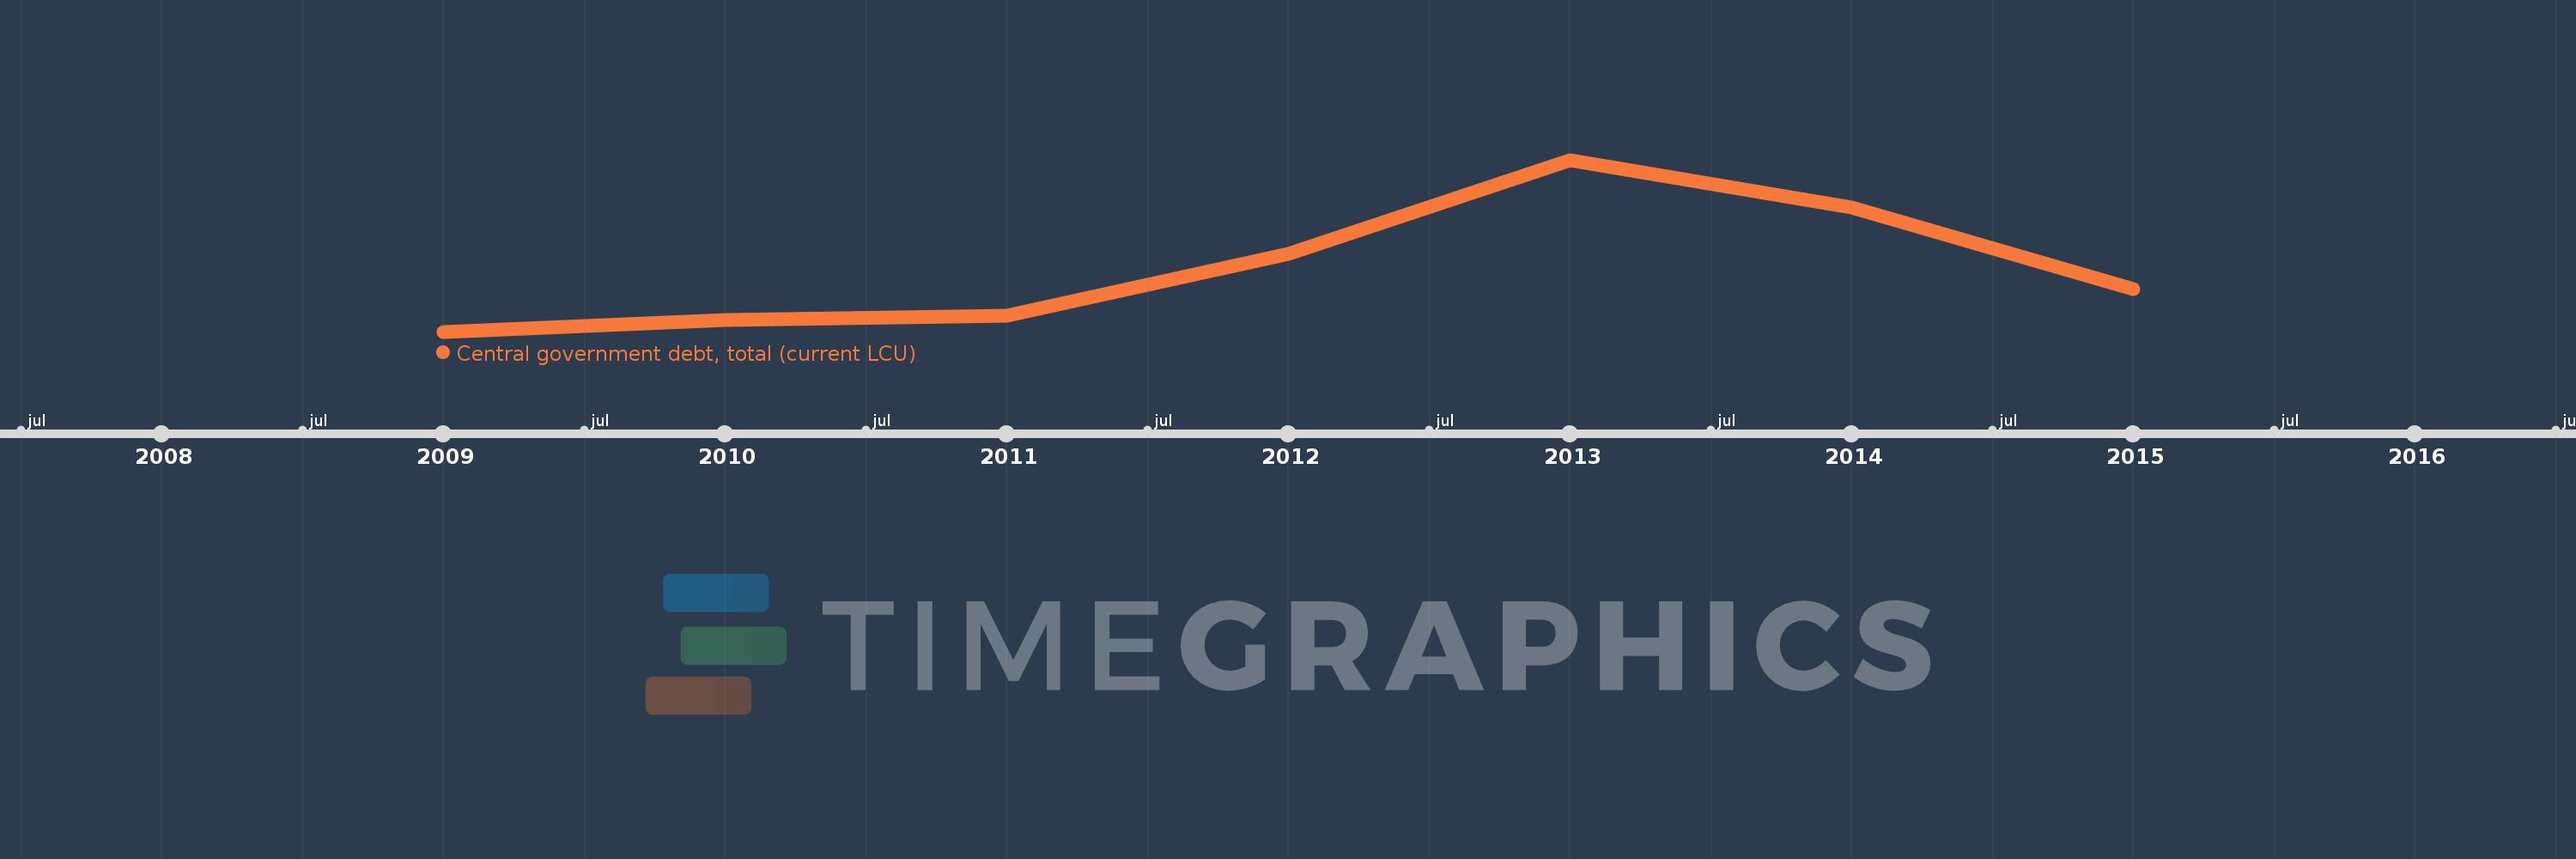
This timeline shows a graph from 2009 to 2015 of Micronesia, Fed. Sts.. No data until 2008. Number of actual observations by date: 7.
Source name:
World Development Indicators
Source organization:
International Monetary Fund, Government Finance Statistics Yearbook and data files.
Categories, topics:
Public Sector
Last updated:
apr 23, 2017
Indicators value changes by year
Minimum:
70.02 mln
jan 1, 2009
Maximum:
88.734 mln
jan 1, 2013
At the date of observation
Value
Absolute change
Change from the previous value
jan 1, 2009
70.02 mln
+70.02 mln
0.0%
jan 1, 2010
71.309 mln
+1.289 mln
1.84%
jan 1, 2011
71.726 mln
+417.547K
0.59%
jan 1, 2012
78.454 mln
+6.728 mln
9.38%
jan 1, 2013
88.734 mln
+10.28 mln
13.1%
jan 1, 2014
83.5 mln
-5.234 mln
-5.9%
jan 1, 2015
74.677 mln
-8.824 mln
-10.57%
Ranking of countries by current statistics by years