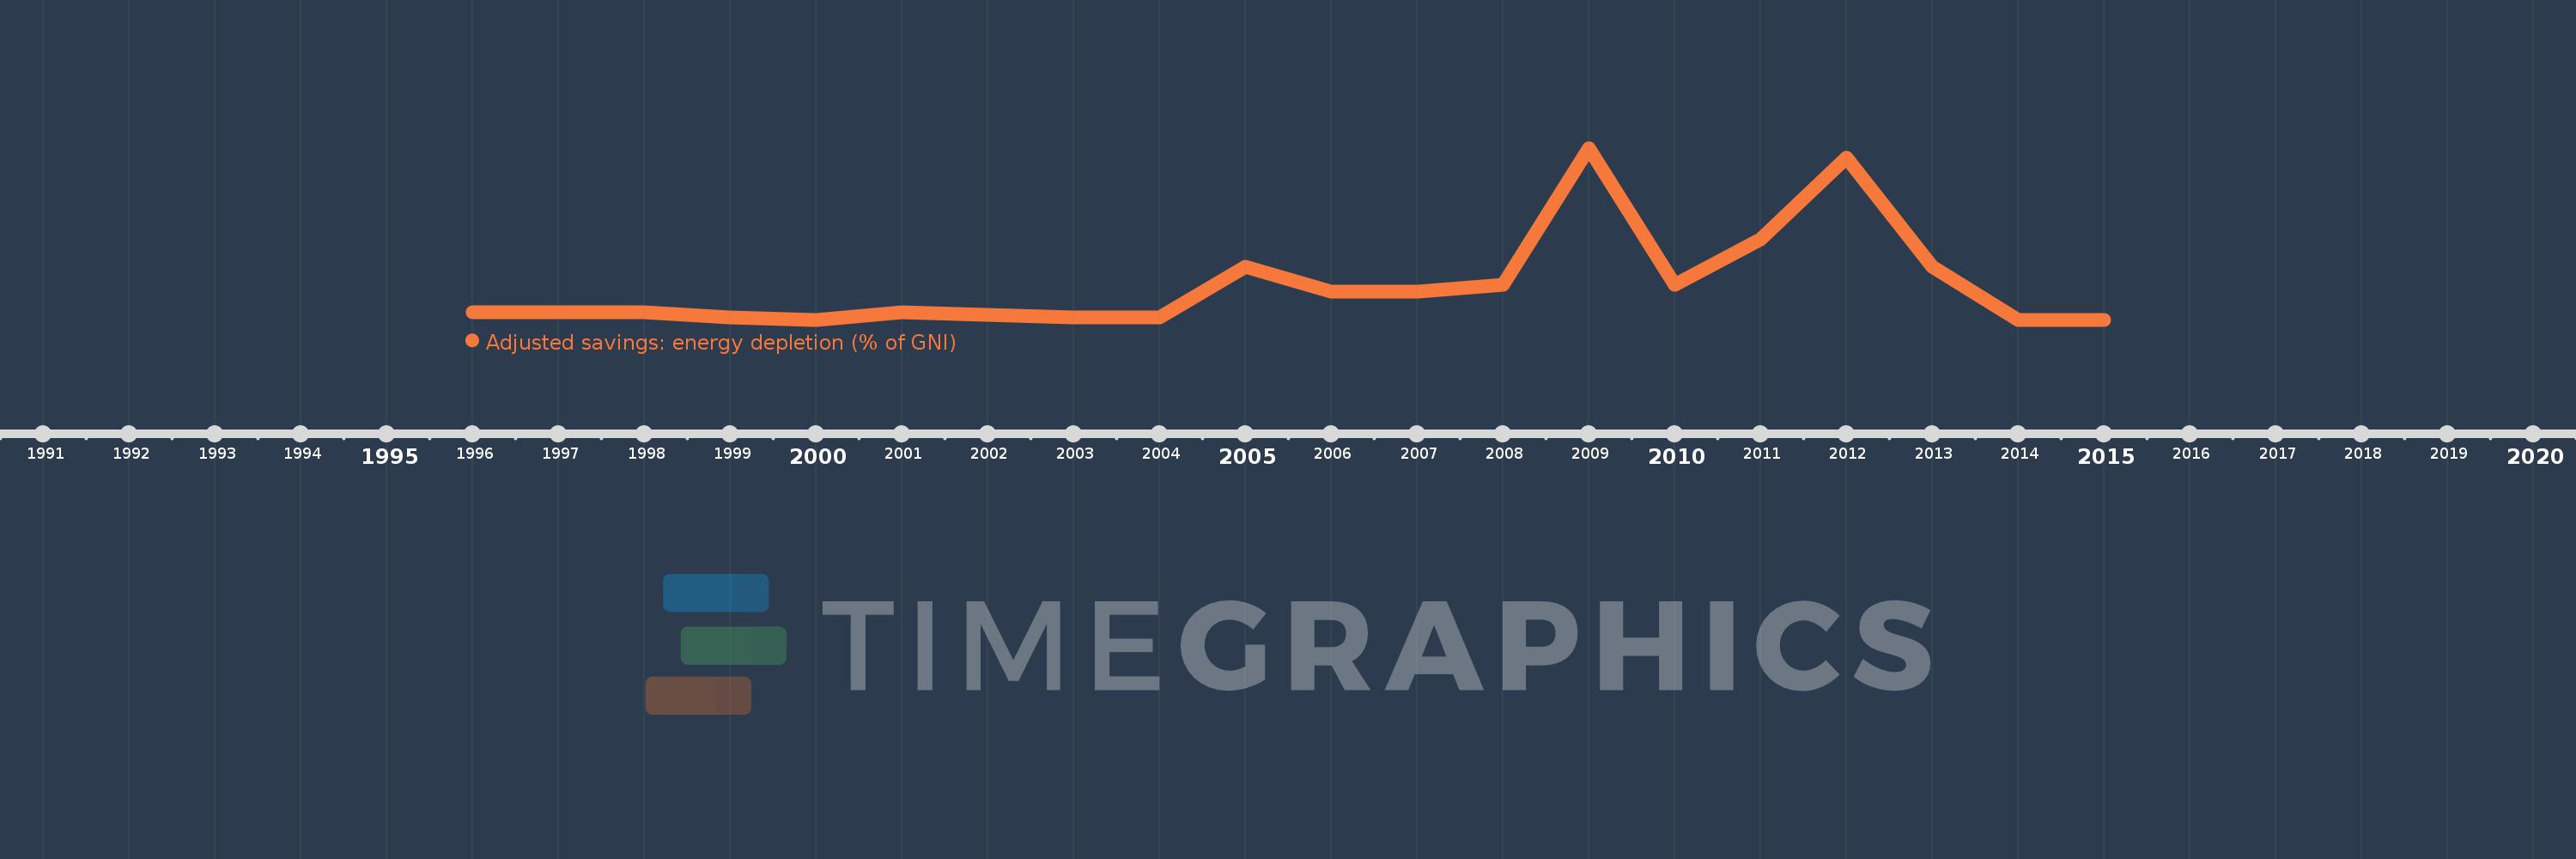
This timeline shows a graph from 1996 to 2015 of Slovenia. No data until 1995. Number of actual observations by date: 20.
Source name:
World Development Indicators
Source organization:
World Bank staff estimates based on sources and methods in World Bank's "The Changing Wealth of Nations: Measuring Sustainable Development in the New Millennium" (2011).
Categories, topics:
Economy & Growth, Energy & Mining, Environment
Last updated:
apr 23, 2017
Indicators value changes by year
Meaning:
0.015
Minimum:
0.001
jan 1, 2015
Maximum:
0.069
jan 1, 2009
At the date of observation
Value
Absolute change
Change from the previous value
jan 1, 1996
0.004
+0.004
0.0%
jan 1, 1997
0.004
0.0
-7.33%
jan 1, 1998
0.004
0.0
-7.56%
jan 1, 1999
0.002
-0.002
-53.7%
jan 1, 2000
0.001
0.0
-29.48%
jan 1, 2001
0.004
+0.003
226.4%
jan 1, 2002
0.003
-0.001
-24.67%
jan 1, 2003
0.002
-0.001
-32.49%
jan 1, 2004
0.002
+0.0
5.58%
jan 1, 2005
0.022
+0.02
959.1%
jan 1, 2006
0.012
-0.01
-45.95%
jan 1, 2007
0.012
+0.001
5.7%
jan 1, 2008
0.015
+0.003
20.53%
jan 1, 2009
0.069
+0.054
360.36%
jan 1, 2010
0.015
-0.054
-78.07%
jan 1, 2011
0.033
+0.018
117.61%
jan 1, 2012
0.065
+0.032
97.27%
jan 1, 2013
0.022
-0.043
-66.62%
jan 1, 2014
0.001
-0.021
-96.18%
jan 1, 2015
0.001
0.0
-38.91%
Ranking of countries by current statistics by years