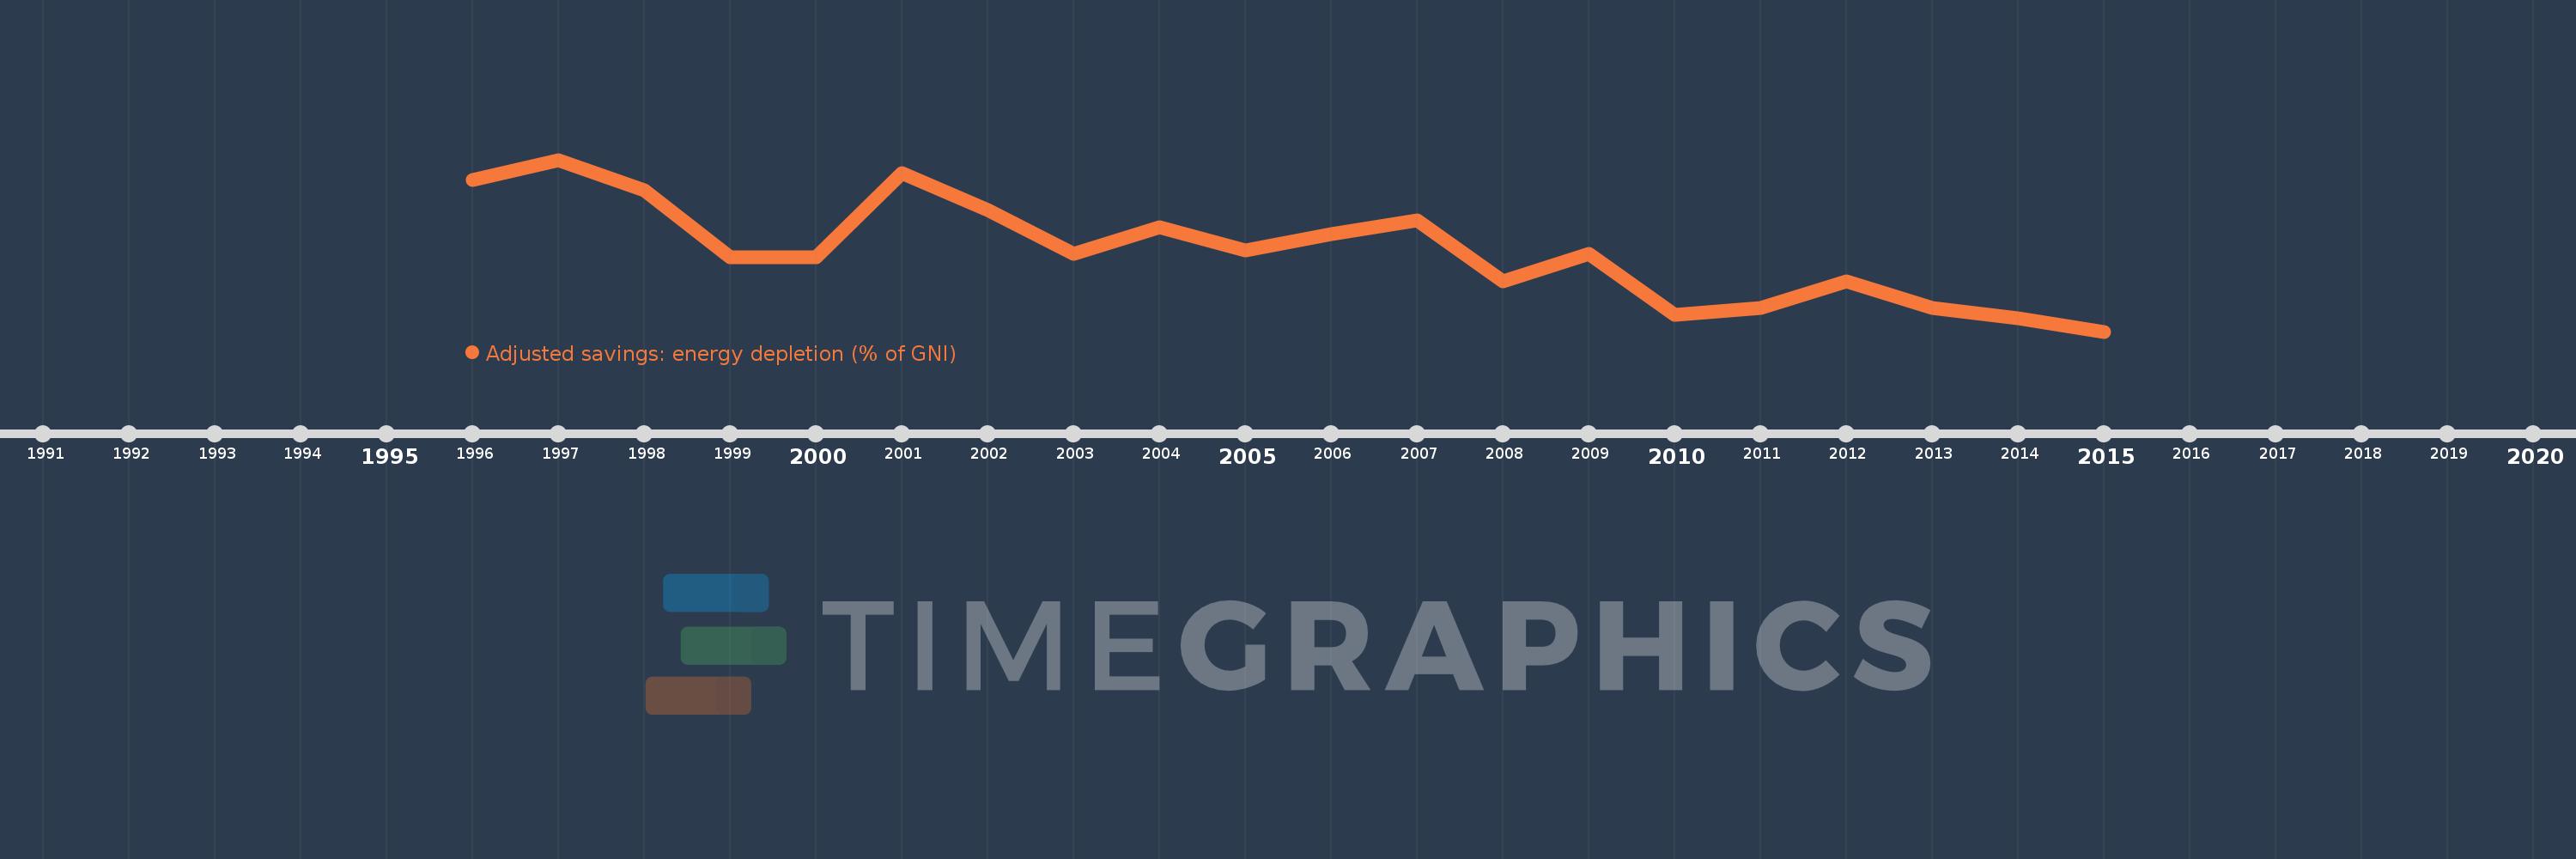
This timeline shows a graph from 1996 to 2015 of Slovak Republic. No data until 1995. Number of actual observations by date: 20.
Source name:
World Development Indicators
Source organization:
World Bank staff estimates based on sources and methods in World Bank's "The Changing Wealth of Nations: Measuring Sustainable Development in the New Millennium" (2011).
Categories, topics:
Economy & Growth, Energy & Mining, Environment
Last updated:
apr 23, 2017
Indicators value changes by year
Meaning:
0.029
Minimum:
0.005
jan 1, 2015
Maximum:
0.056
jan 1, 1997
At the date of observation
Value
Absolute change
Change from the previous value
jan 1, 1996
0.05
+0.05
0.0%
jan 1, 1997
0.056
+0.005
10.38%
jan 1, 1998
0.047
-0.009
-16.37%
jan 1, 1999
0.027
-0.02
-42.54%
jan 1, 2000
0.027
0.0
-0.73%
jan 1, 2001
0.052
+0.025
94.39%
jan 1, 2002
0.041
-0.011
-20.38%
jan 1, 2003
0.028
-0.013
-32.25%
jan 1, 2004
0.036
+0.008
27.86%
jan 1, 2005
0.029
-0.007
-19.58%
jan 1, 2006
0.034
+0.006
19.4%
jan 1, 2007
0.038
+0.004
11.98%
jan 1, 2008
0.02
-0.018
-46.89%
jan 1, 2009
0.028
+0.007
36.56%
jan 1, 2010
0.01
-0.018
-64.7%
jan 1, 2011
0.012
+0.002
19.31%
jan 1, 2012
0.02
+0.008
71.3%
jan 1, 2013
0.012
-0.008
-40.75%
jan 1, 2014
0.009
-0.003
-24.39%
jan 1, 2015
0.005
-0.004
-43.67%
Ranking of countries by current statistics by years