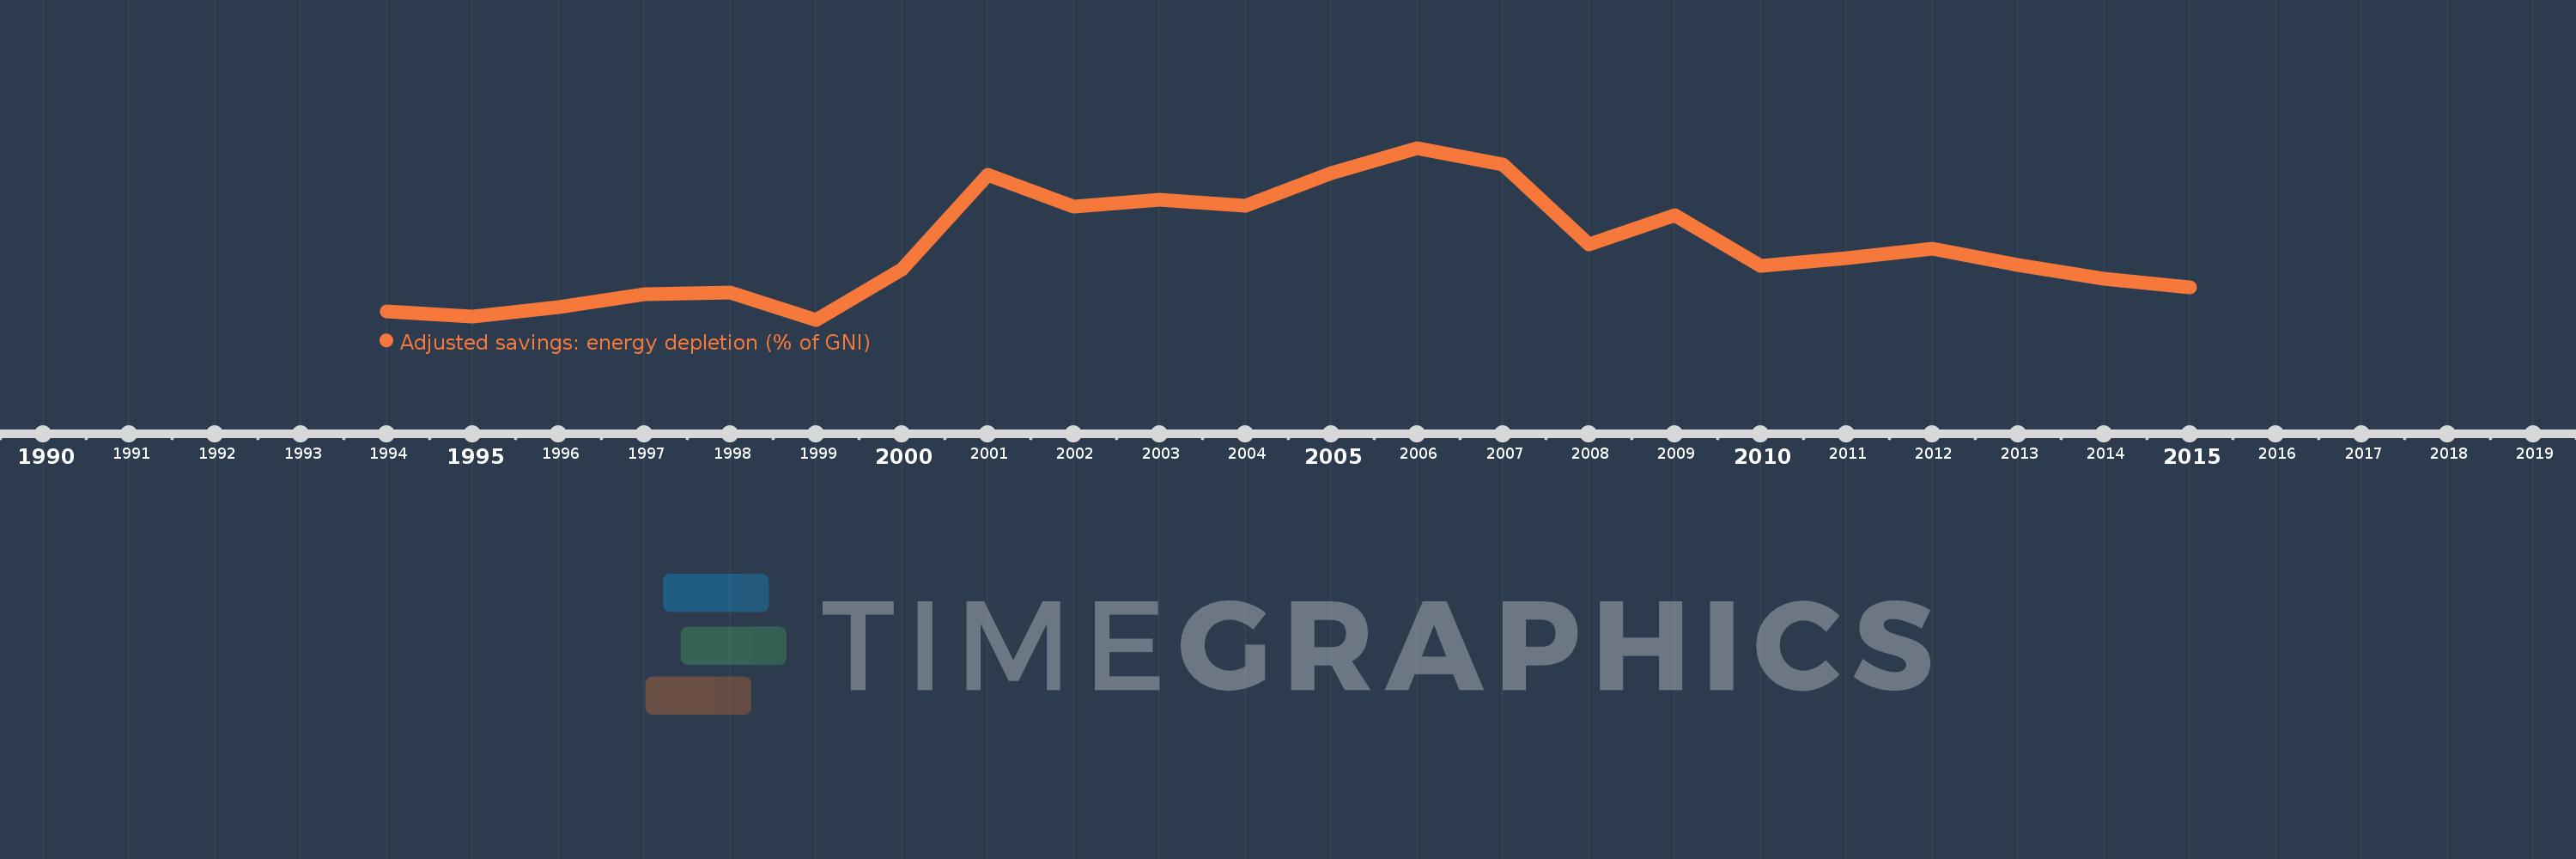
This timeline shows a graph from 1994 to 2015 of Kazakhstan. No data until 1993. Number of actual observations by date: 22.
Source name:
World Development Indicators
Source organization:
World Bank staff estimates based on sources and methods in World Bank's "The Changing Wealth of Nations: Measuring Sustainable Development in the New Millennium" (2011).
Categories, topics:
Economy & Growth, Energy & Mining, Environment
Last updated:
apr 23, 2017
Indicators value changes by year
Meaning:
18.295
Minimum:
6.568
jan 1, 1999
Maximum:
34.468
jan 1, 2006
At the date of observation
Value
Absolute change
Change from the previous value
jan 1, 1994
7.979
+7.979
0.0%
jan 1, 1995
7.079
-0.901
-11.29%
jan 1, 1996
8.577
+1.498
21.16%
jan 1, 1997
10.71
+2.133
24.87%
jan 1, 1998
11.031
+0.321
3.0%
jan 1, 1999
6.568
-4.463
-40.46%
jan 1, 2000
14.694
+8.126
123.73%
jan 1, 2001
30.059
+15.364
104.56%
jan 1, 2002
24.925
-5.133
-17.08%
jan 1, 2003
26.106
+1.181
4.74%
jan 1, 2004
25.093
-1.013
-3.88%
jan 1, 2005
30.375
+5.282
21.05%
jan 1, 2006
34.468
+4.093
13.47%
jan 1, 2007
31.803
-2.665
-7.73%
jan 1, 2008
18.812
-12.991
-40.85%
jan 1, 2009
23.601
+4.788
25.45%
jan 1, 2010
15.271
-8.33
-35.29%
jan 1, 2011
16.574
+1.303
8.53%
jan 1, 2012
18.16
+1.586
9.57%
jan 1, 2013
15.519
-2.641
-14.54%
jan 1, 2014
13.271
-2.248
-14.49%
jan 1, 2015
11.822
-1.449
-10.92%
Ranking of countries by current statistics by years