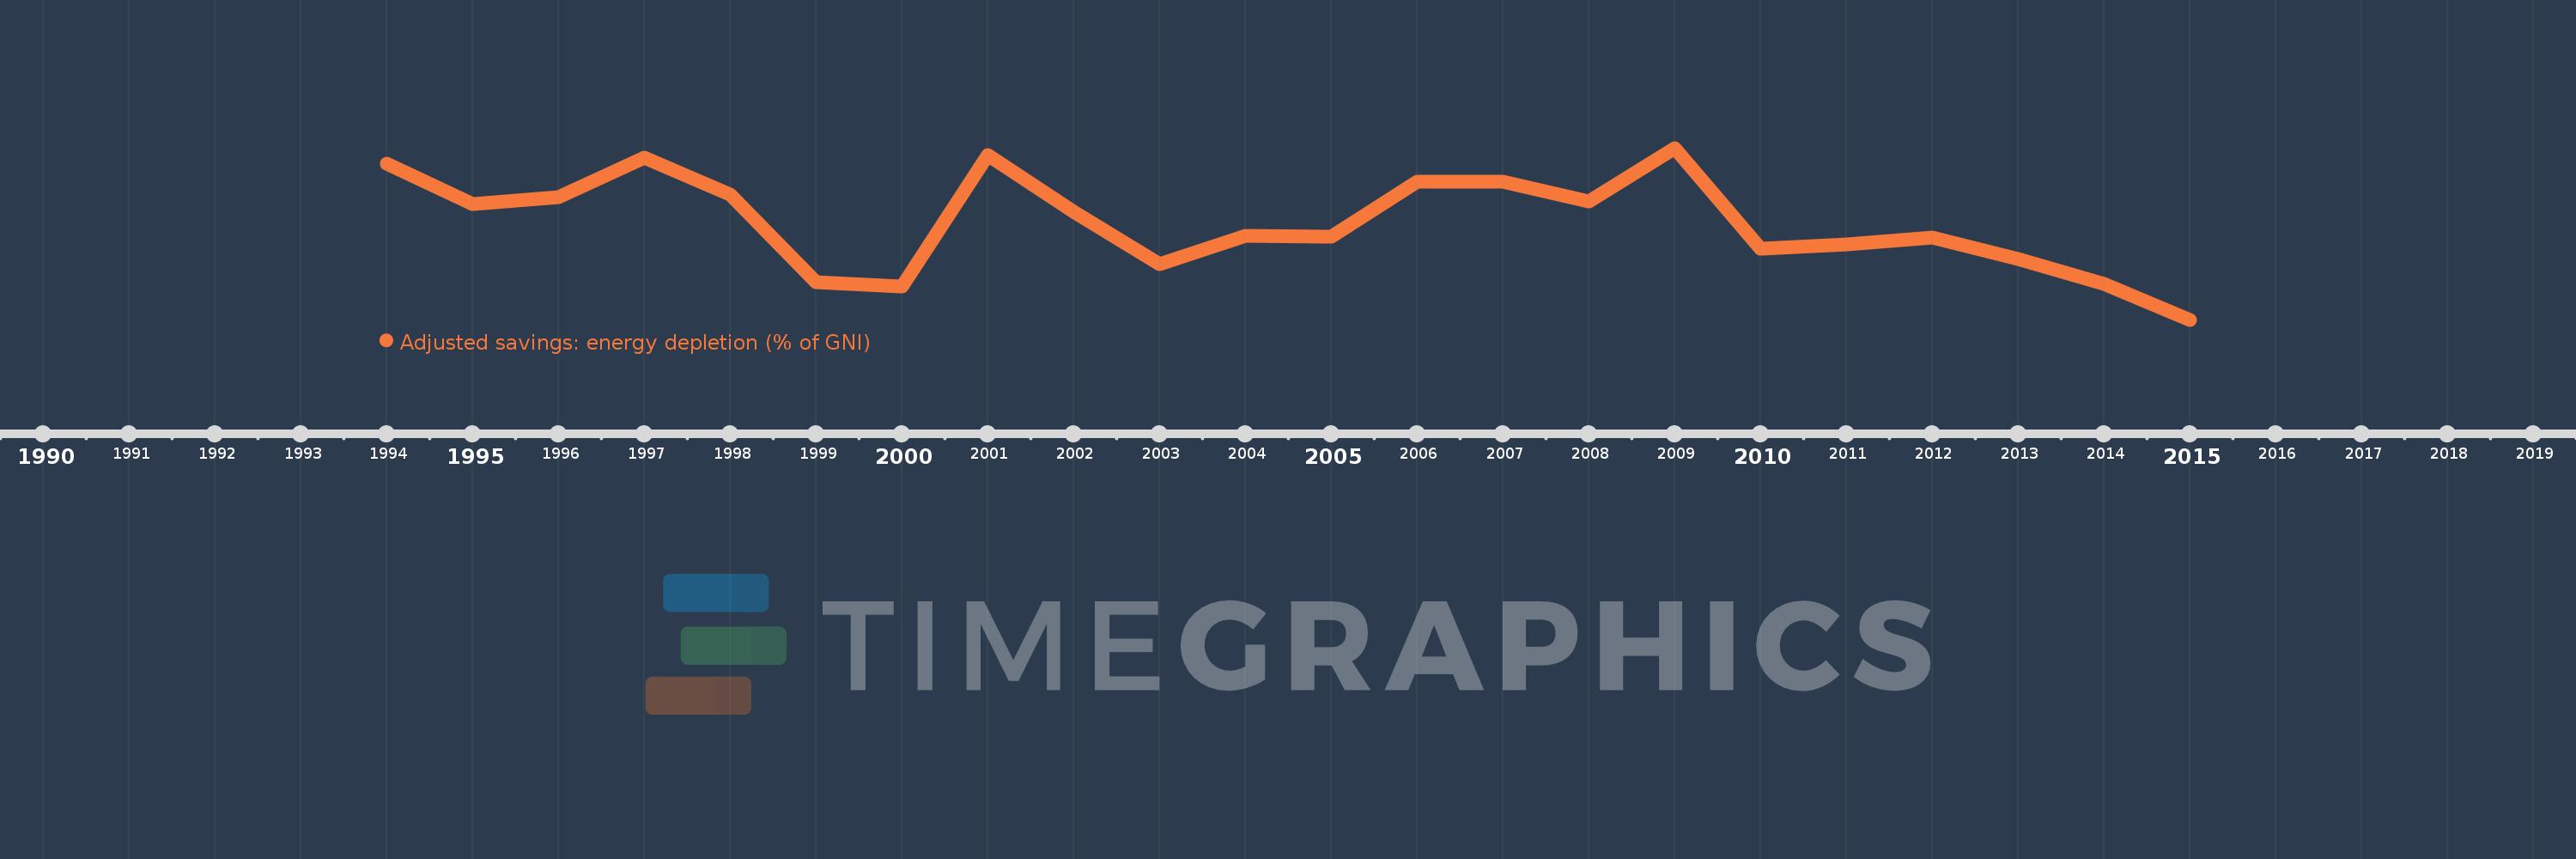
This timeline shows a graph from 1994 to 2015 of Hungary. No data until 1993. Number of actual observations by date: 22.
Source name:
World Development Indicators
Source organization:
World Bank staff estimates based on sources and methods in World Bank's "The Changing Wealth of Nations: Measuring Sustainable Development in the New Millennium" (2011).
Categories, topics:
Economy & Growth, Energy & Mining, Environment
Last updated:
apr 23, 2017
Indicators value changes by year
Meaning:
0.581
Minimum:
0.26
jan 1, 2015
Maximum:
0.827
jan 1, 2009
At the date of observation
Value
Absolute change
Change from the previous value
jan 1, 1994
0.774
+0.774
0.0%
jan 1, 1995
0.642
-0.132
-17.0%
jan 1, 1996
0.665
+0.023
3.56%
jan 1, 1997
0.795
+0.13
19.54%
jan 1, 1998
0.672
-0.123
-15.49%
jan 1, 1999
0.385
-0.287
-42.67%
jan 1, 2000
0.369
-0.016
-4.25%
jan 1, 2001
0.804
+0.435
118.05%
jan 1, 2002
0.616
-0.188
-23.34%
jan 1, 2003
0.444
-0.172
-27.93%
jan 1, 2004
0.537
+0.092
20.82%
jan 1, 2005
0.533
-0.004
-0.68%
jan 1, 2006
0.717
+0.184
34.43%
jan 1, 2007
0.717
+0.001
0.07%
jan 1, 2008
0.65
-0.067
-9.36%
jan 1, 2009
0.827
+0.177
27.2%
jan 1, 2010
0.495
-0.332
-40.12%
jan 1, 2011
0.51
+0.014
2.92%
jan 1, 2012
0.532
+0.022
4.34%
jan 1, 2013
0.46
-0.072
-13.58%
jan 1, 2014
0.377
-0.082
-17.88%
jan 1, 2015
0.26
-0.118
-31.17%
Ranking of countries by current statistics by years