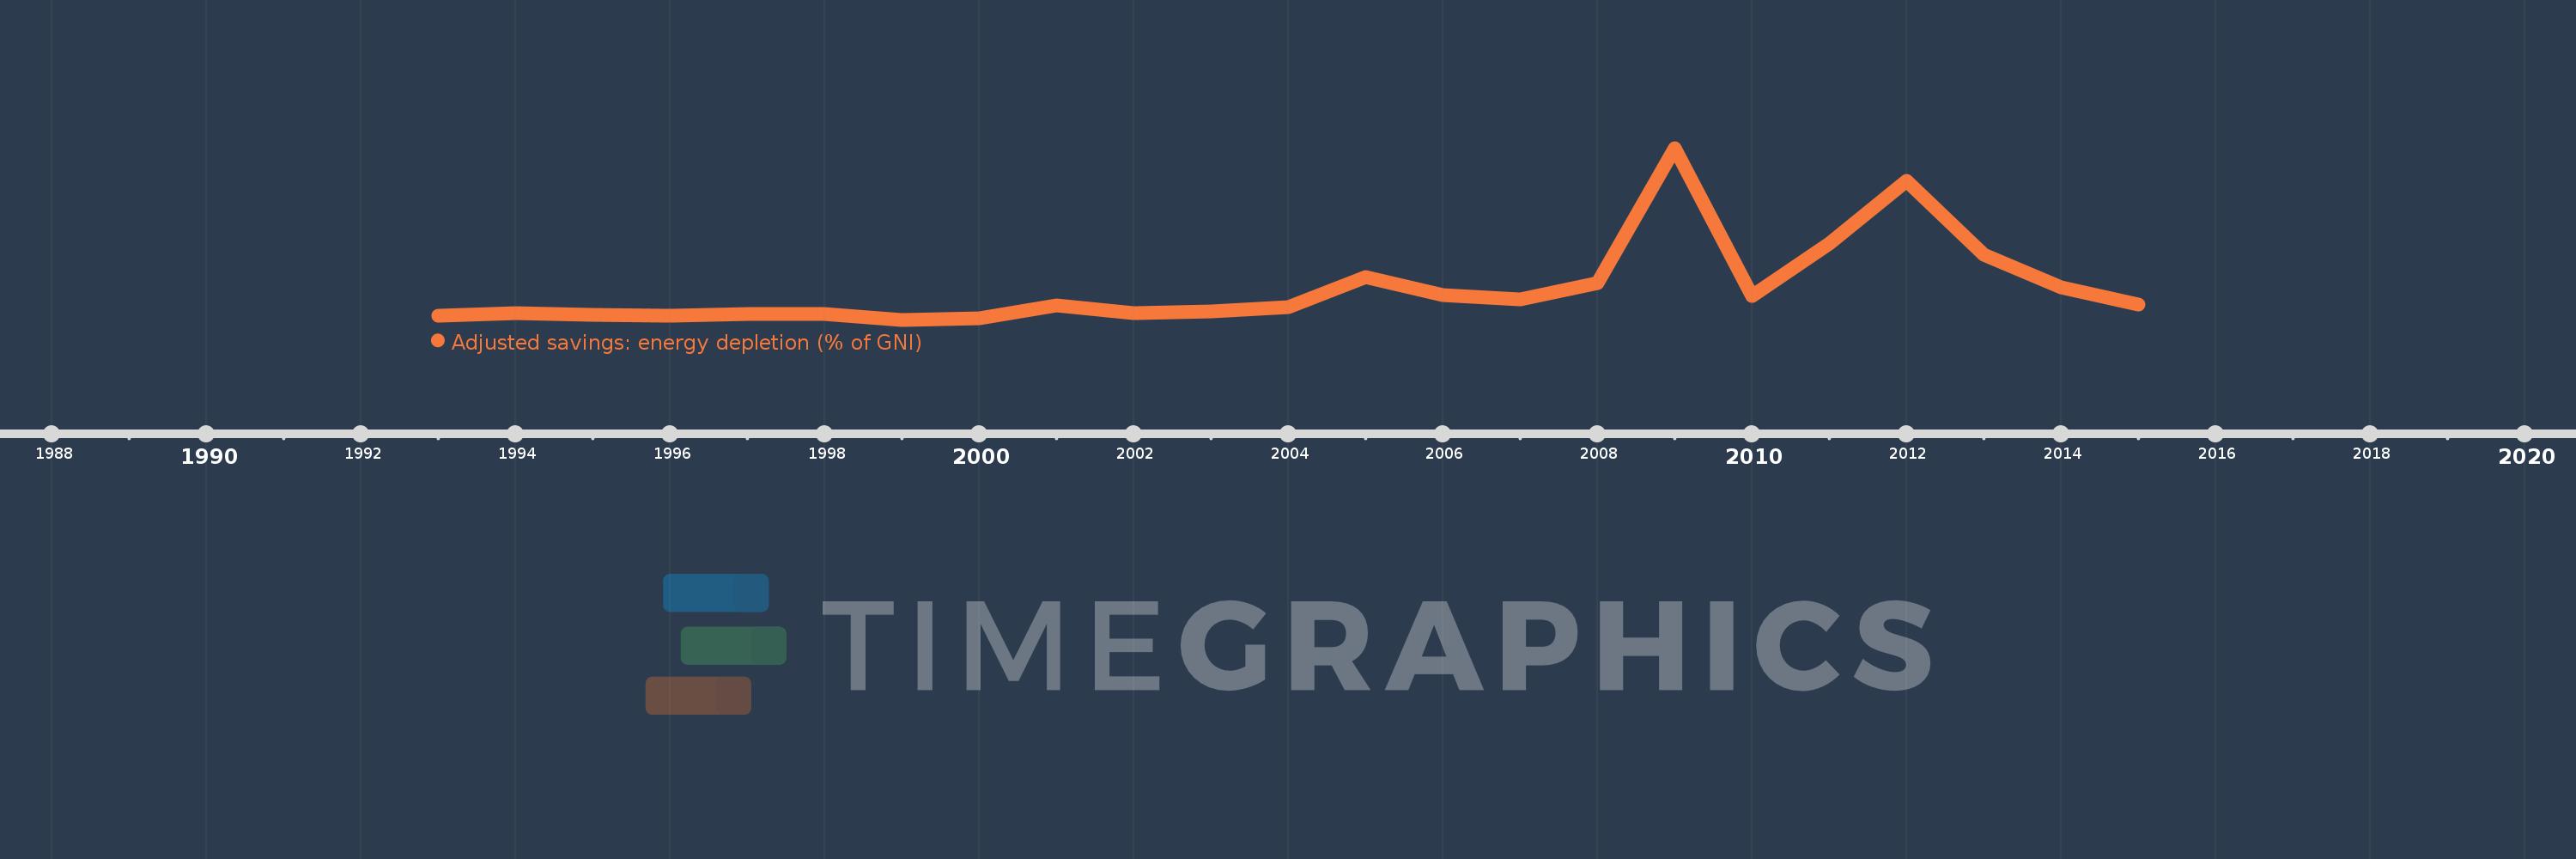
This timeline shows a graph from 1993 to 2015 of Czech Republic. No data until 1992. Number of actual observations by date: 23.
Source name:
World Development Indicators
Source organization:
World Bank staff estimates based on sources and methods in World Bank's "The Changing Wealth of Nations: Measuring Sustainable Development in the New Millennium" (2011).
Categories, topics:
Economy & Growth, Energy & Mining, Environment
Last updated:
apr 23, 2017
Indicators value changes by year
Meaning:
0.114
Minimum:
0.027
jan 1, 1999
Maximum:
0.503
jan 1, 2009
At the date of observation
Value
Absolute change
Change from the previous value
jan 1, 1993
0.038
+0.038
0.0%
jan 1, 1994
0.046
+0.009
22.9%
jan 1, 1995
0.04
-0.007
-14.56%
jan 1, 1996
0.037
-0.003
-6.4%
jan 1, 1997
0.043
+0.005
14.39%
jan 1, 1998
0.042
0.0
-0.51%
jan 1, 1999
0.027
-0.015
-36.64%
jan 1, 2000
0.031
+0.005
17.03%
jan 1, 2001
0.067
+0.036
113.62%
jan 1, 2002
0.046
-0.021
-31.34%
jan 1, 2003
0.049
+0.003
6.7%
jan 1, 2004
0.063
+0.014
28.17%
jan 1, 2005
0.146
+0.083
131.39%
jan 1, 2006
0.095
-0.051
-34.9%
jan 1, 2007
0.083
-0.012
-12.5%
jan 1, 2008
0.129
+0.046
55.48%
jan 1, 2009
0.503
+0.374
290.46%
jan 1, 2010
0.092
-0.411
-81.71%
jan 1, 2011
0.238
+0.146
158.79%
jan 1, 2012
0.411
+0.173
72.6%
jan 1, 2013
0.208
-0.203
-49.48%
jan 1, 2014
0.117
-0.091
-43.58%
jan 1, 2015
0.07
-0.047
-39.93%
Ranking of countries by current statistics by years