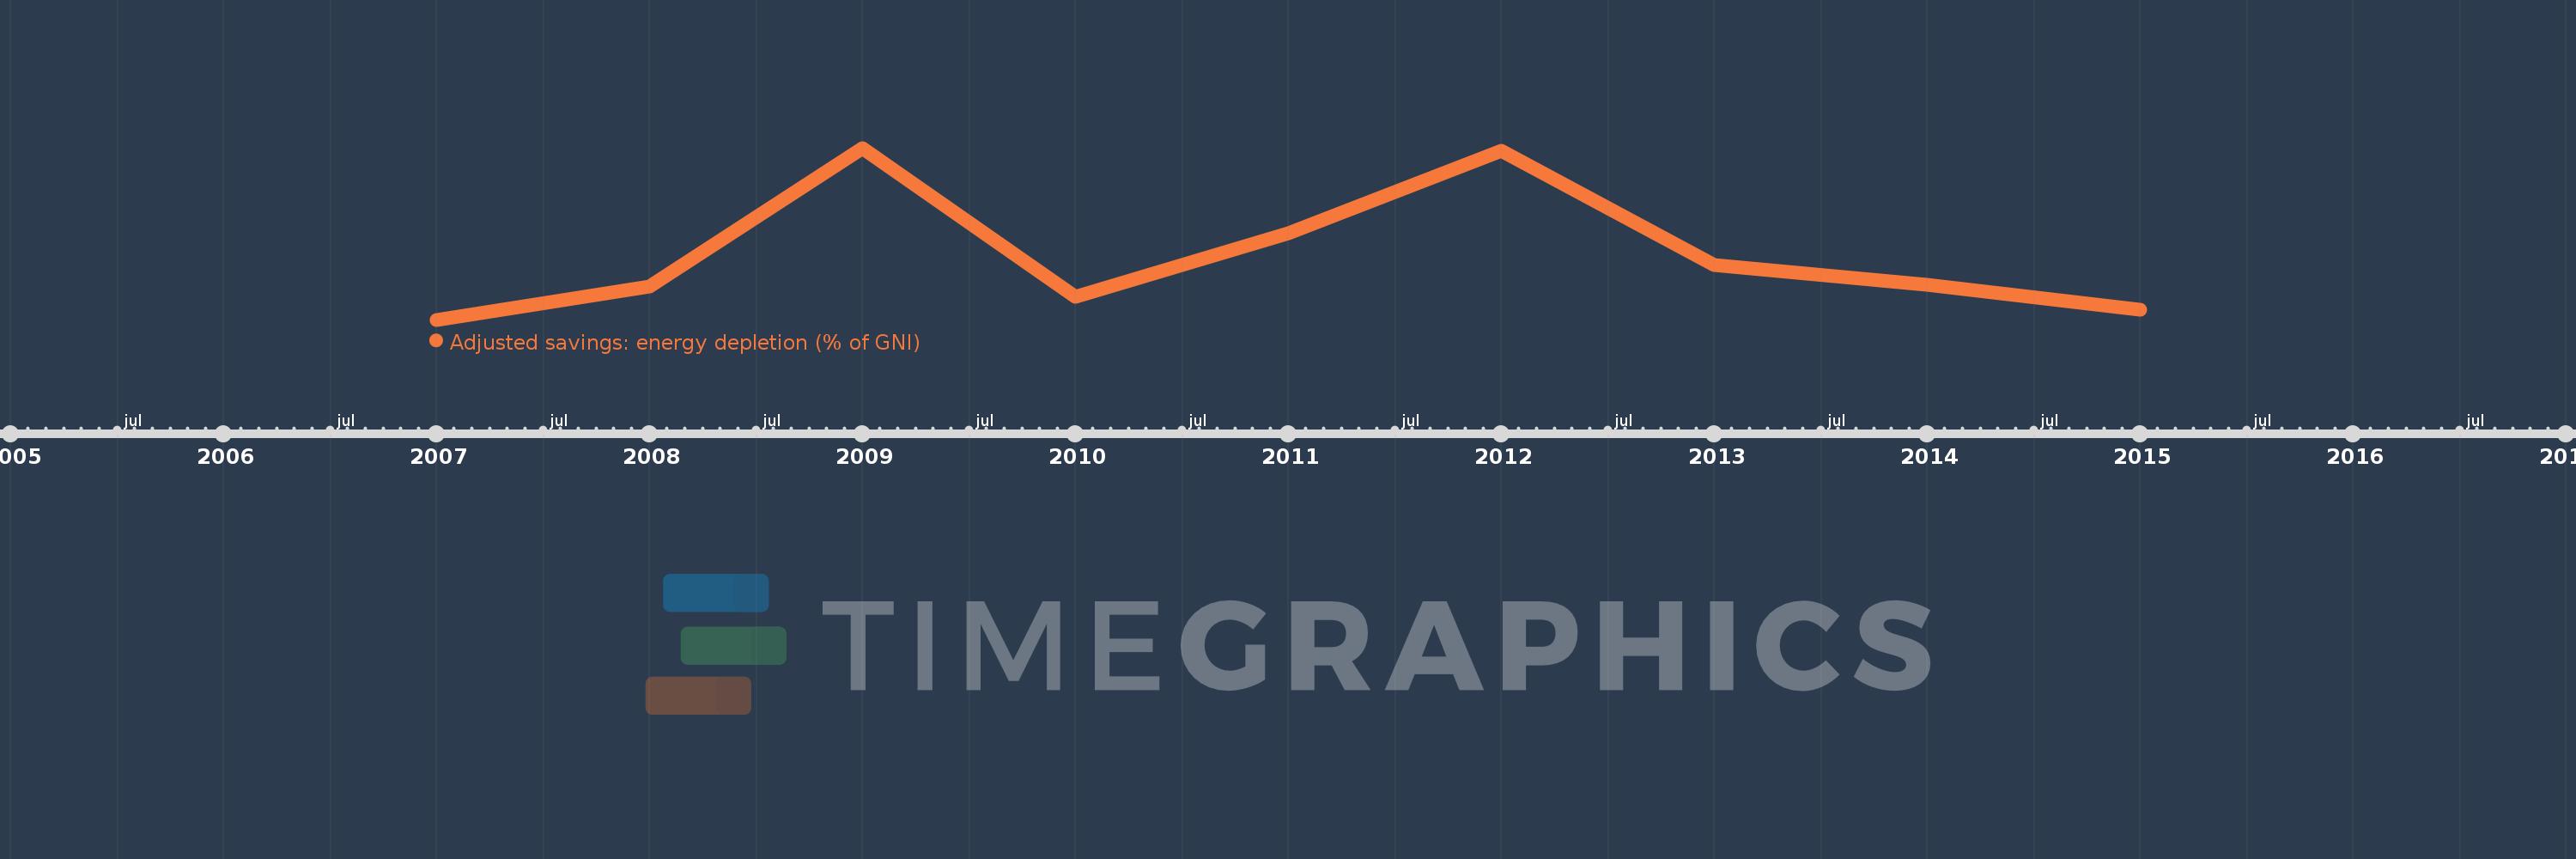
This timeline shows a graph from 2007 to 2015 of Kosovo. No data until 2006. Number of actual observations by date: 9.
Source name:
World Development Indicators
Source organization:
World Bank staff estimates based on sources and methods in World Bank's "The Changing Wealth of Nations: Measuring Sustainable Development in the New Millennium" (2011).
Categories, topics:
Economy & Growth, Energy & Mining, Environment
Last updated:
apr 23, 2017
Indicators value changes by year
Meaning:
0.217
Minimum:
0.072
jan 1, 2007
Maximum:
0.456
jan 1, 2009
At the date of observation
Value
Absolute change
Change from the previous value
jan 1, 2007
0.072
+0.072
0.0%
jan 1, 2008
0.147
+0.074
102.72%
jan 1, 2009
0.456
+0.309
210.68%
jan 1, 2010
0.124
-0.332
-72.78%
jan 1, 2011
0.265
+0.141
113.59%
jan 1, 2012
0.449
+0.184
69.59%
jan 1, 2013
0.195
-0.254
-56.6%
jan 1, 2014
0.15
-0.045
-22.92%
jan 1, 2015
0.094
-0.057
-37.73%
Ranking of countries by current statistics by years